The Brown PLT Blog

Articles by tag: Visualization
Forge: A Tool to Teach Formal Methods
A Grounded Conceptual Model for Ownership Types in Rust
Applying Cognitive Principles to Model-Finding Output
Picking Colors for Pyret Error Messages
User Studies of Principled Model Finder Output
Resugaring Evaluation Sequences
Lightweight Diagramming for Lightweight Formal Methods
Tags: Formal Methods, Tools, Verification, Visualization
Posted on 09 June 2025.Formal methods tools like Alloy and Forge help users define, explore, verify, and diagnose specifications for complex systems incrementally. A crucial feature of these tools is their visualizer, which lets users explore generated models through graphical representations.
In some cases, they suffer from familiar usability issues—such as overlapping lines, unclear labels, or cluttered layouts—that make it hard to understand what the model represents. But even when the diagrams are clean and well-organized, they can still be confusing if the layout doesn’t reflect the structure that users expect.
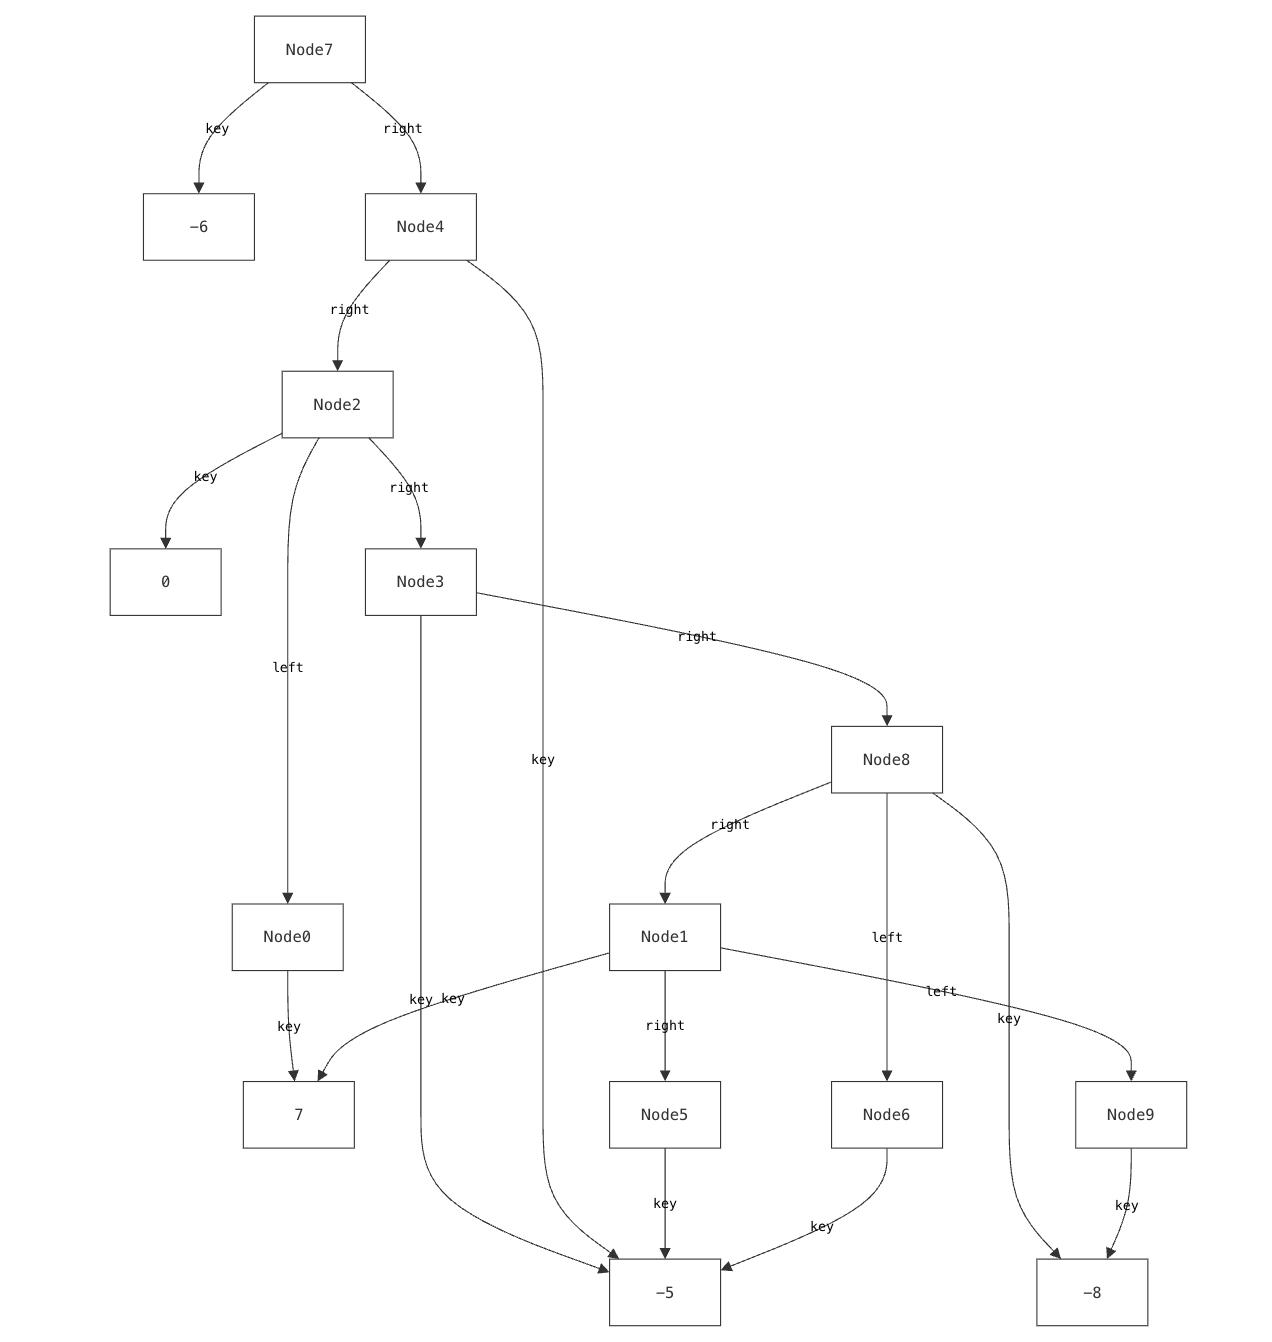
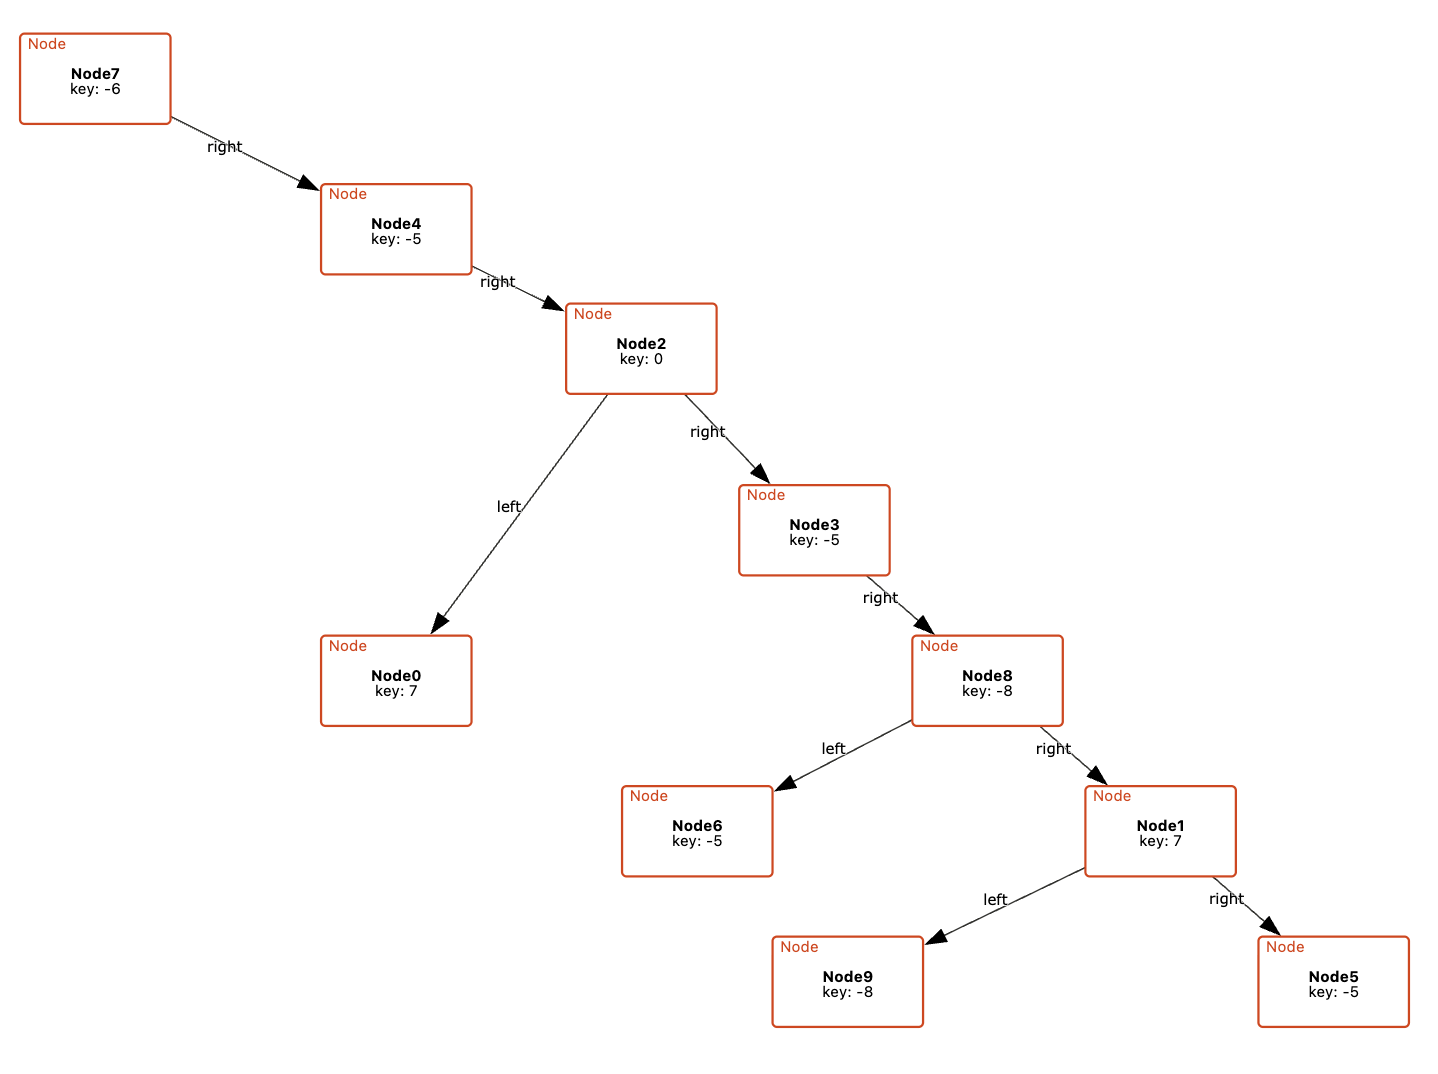
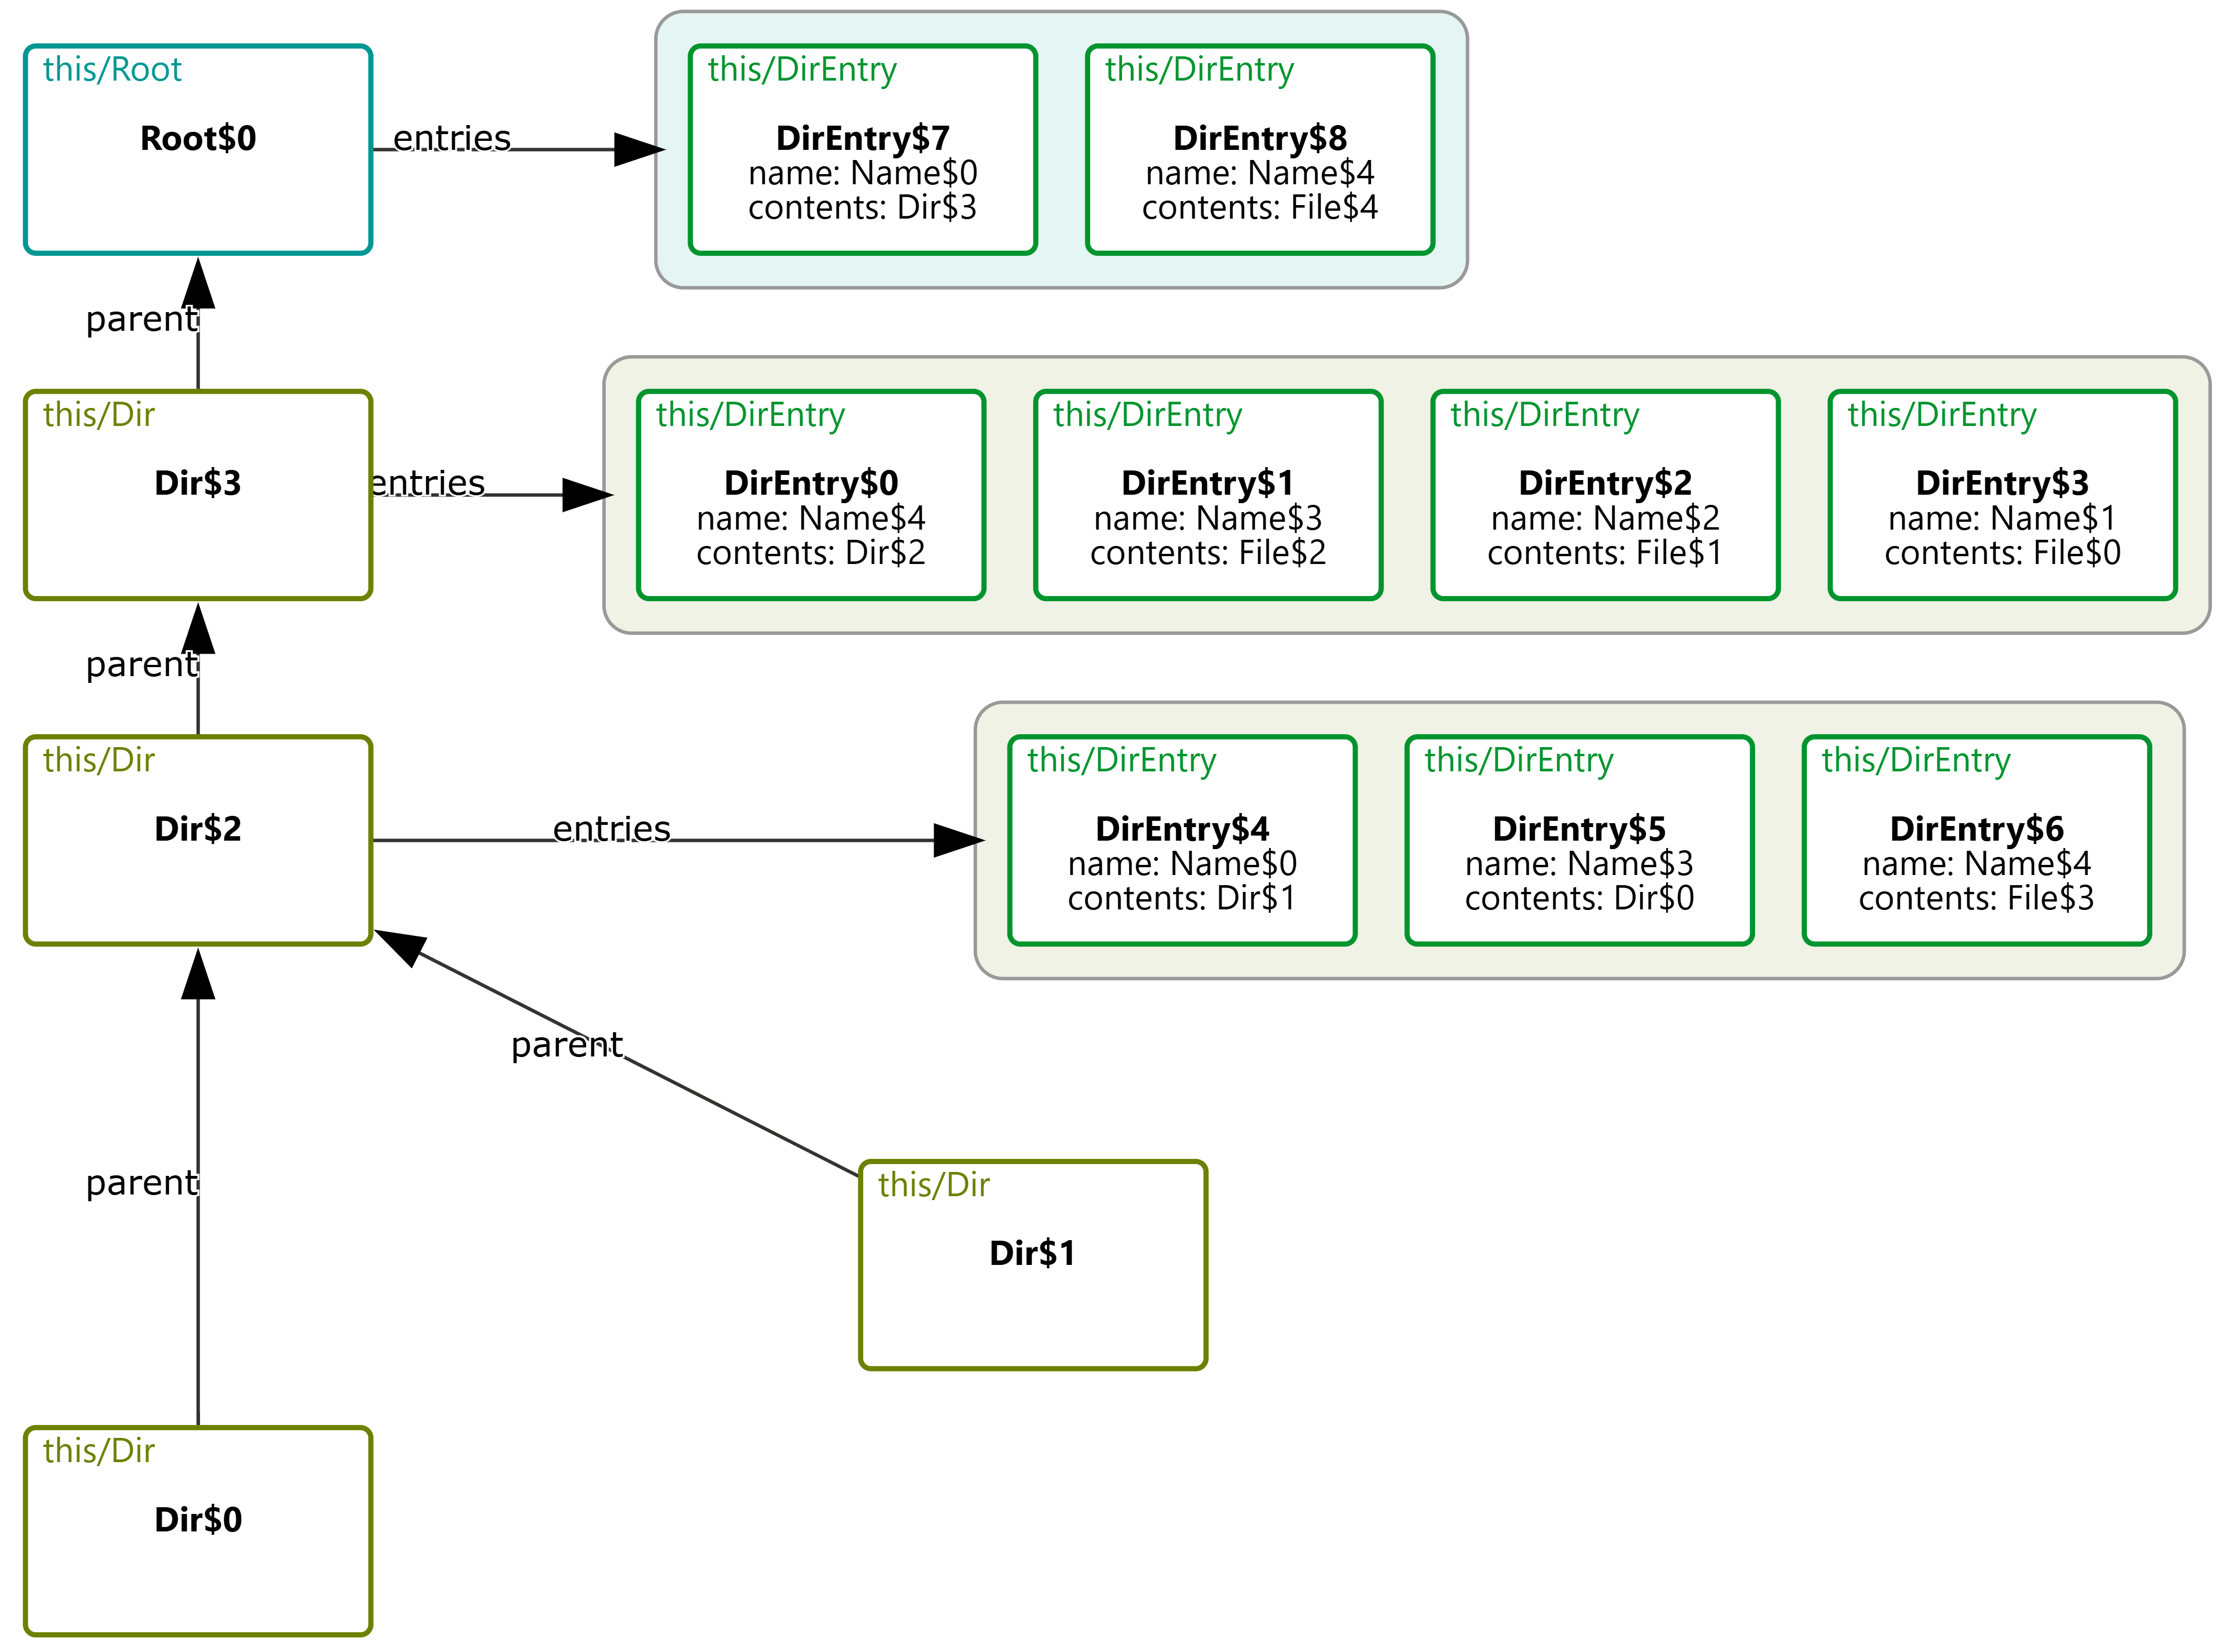
For example, a visualization of a binary tree might place left and right children arbitrarily, rather than arranging them to the left and right of their parent node. This breaks with common conventions and can make it harder for users to quickly recognize familiar structures. Similarly, if a model is meant to convey a specific organization (e.g., the grouping of files in a directory) but the visualization fails to reflect this, it becomes difficult to discern the intended relationships, making the model harder to interpret and reason about.
Our previous research has explored using custom, domain-specific visualizations to address this challenge. Yet existing tools for custom visualization come with several significant drawbacks:
- Users must learn and use entirely different languages to create custom visualizations, learning skills (like CSS) that have nothing to do with formal modeling.
- The level of detail required by these languages (such as controlling how elements are rendered) often makes the visualizer code larger and more complex than the models themselves.
- Most critically, these visualizations can be brittle. While careful visualization design can handle certain edge cases, they are inherently limited by their authors’ assumptions about potential issues. The very “unknown unknowns” that lightweight formal methods exist to help surface are often masked by visualizers.
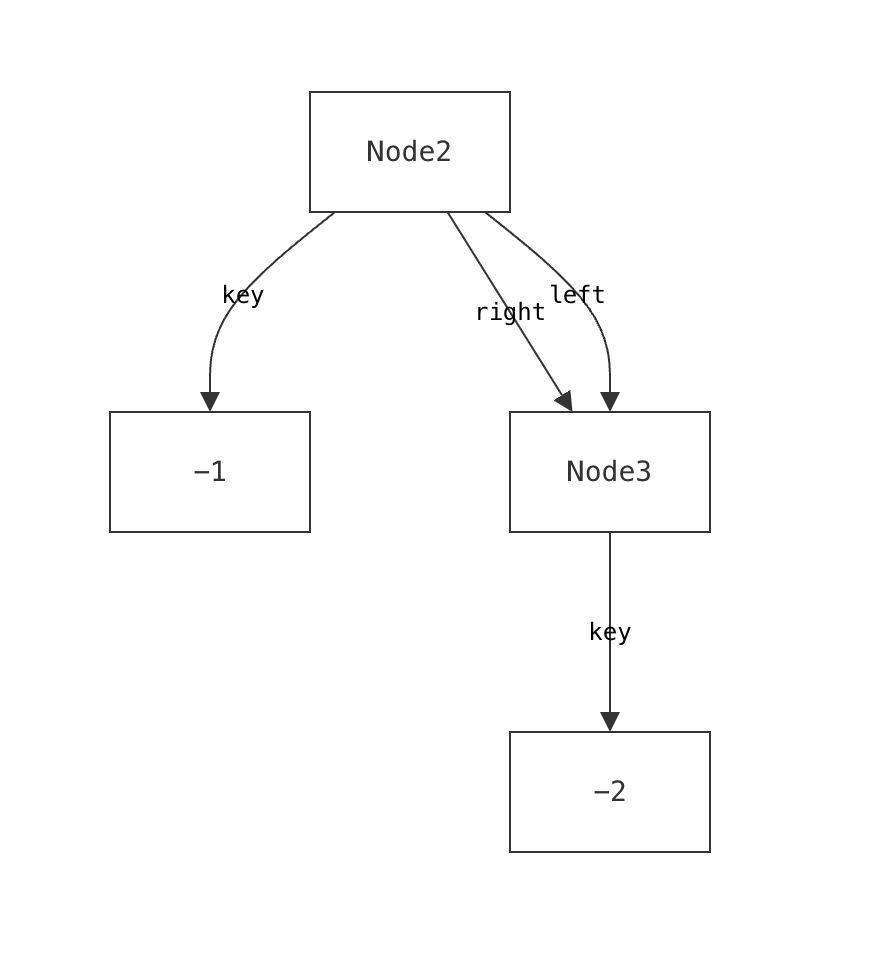
We encountered this issue even when building visualizations for relatively simple data structures that we understand well. It is well-documented that experts suffer from blind spots about what mistakes students might make. When faced with such a modeling mistake, failing to specify that a node’s left and right children must be distinct, our custom visualizer failed silently.
Such failures aren’t merely aesthetic—they actively prevent users from discovering a specification error.
Cope and Drag (or CnD) is a novel lightweight diagramming language built to address these issues. CnD’s design was driven by two approaches:
- A top-down exploration of cognitive science principles that influence spatial reasoning, visualization, and diagramming.
- A bottom-up analysis that distills patterns from dozens of actual custom visualizations.
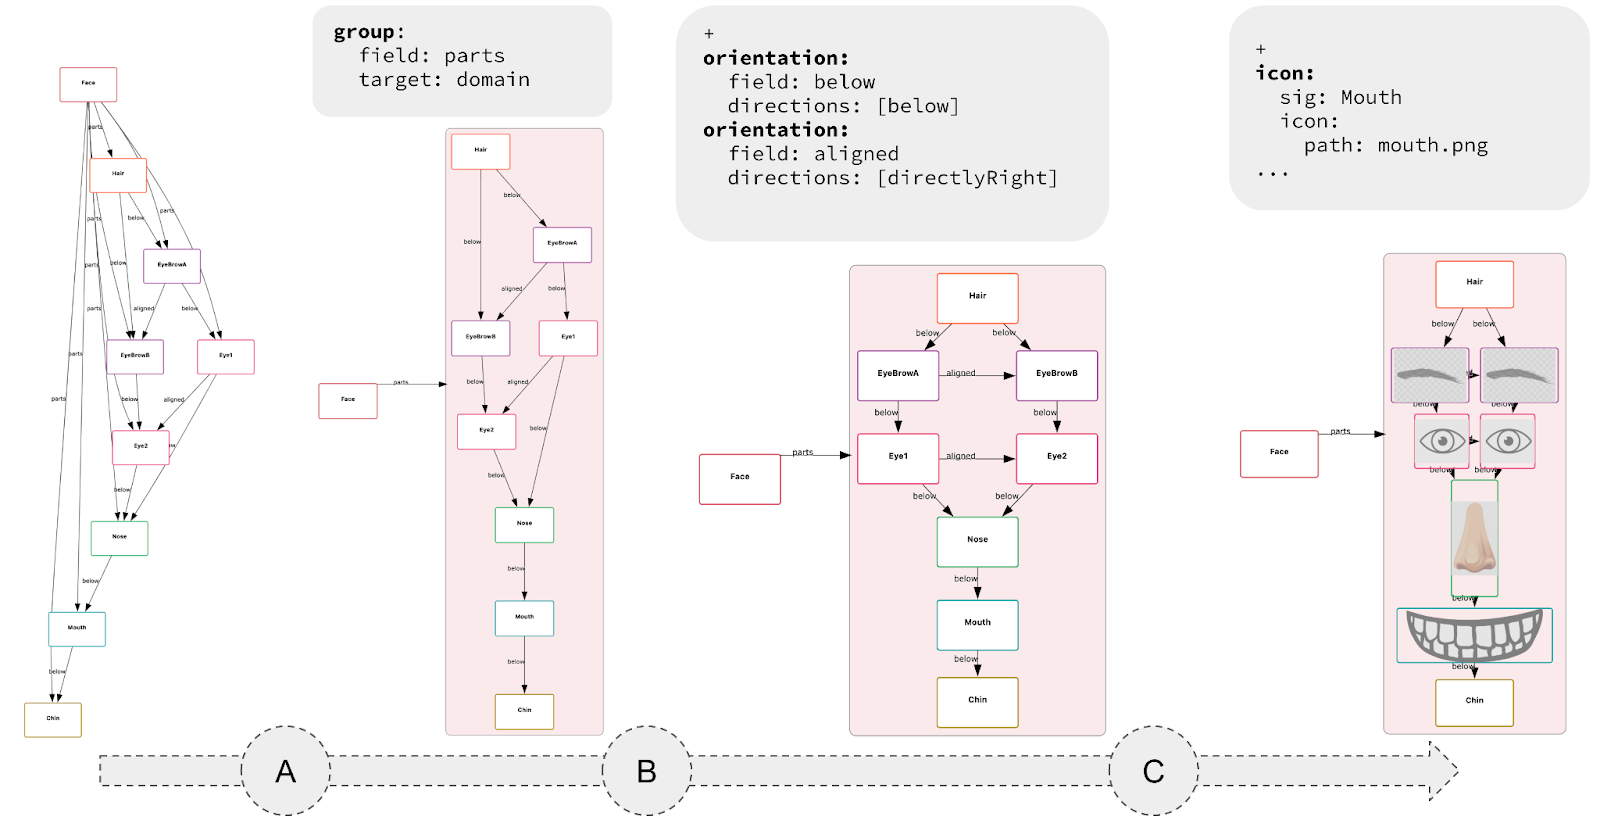
The resulting language is small, requires minimal annotation, and can be used incrementally. The key idea is that each CnD operation meaningfully refines the default visualization. These operations include constraining spatial layout (such as positioning child nodes below their parents in a binary tree), grouping elements (like clustering related components in a software architecture), and directing drawing style (for instance, coloring nodes in a red-black tree based on their color).
Rather than prioritizing aesthetics, CnD focuses on encoding the spatial intuitions implicit in communicating the model. Its lightweight, declarative structure captures these relationships directly.
-
Lightweight Specs, Not Programs: Diagramming with CnD resembles writing a spec, not coding a full program. An empty spec yields a default diagram; each constraint refines it. Unlike traditional viz tools like D3 (where you don’t get a visualization until you’ve written a full program) CnD supports incremental visualization, making it easy to start and evolve alongside your model.
- Useful, not pretty: Generated diagrams may lack the visual polish of more sophisticated tools, but they prioritize structural clarity and correctness over style.The trade-off is a lower ceiling: user’s have less fine-grained control over how diagram elements are rendered (e.g., spacing, fonts, shapes).
-
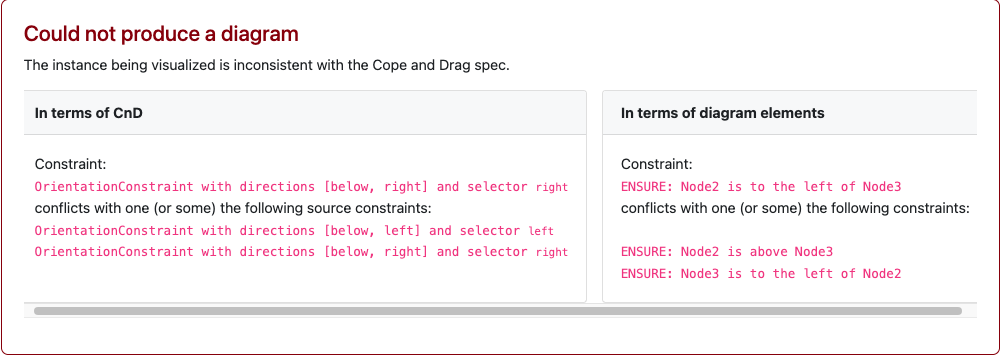
Fail Loudly: CnD constraints are hard constraints. When a diagram fails to match the model, the system prevents visualization and produces a solver-generated error.
For instance, a CnD specification for a binary tree might encode tree layouts as two constraints (lay the left child below and to the left of its parent, and the right child below and to the right of the parent). When faced with the DAG described earlier, CnD identifies that these visualization constraints are unsatisfiable, and produces an error message instead of a misleading diagram.
CnD isn’t the final word on diagramming. It’s one design point in a larger landscape, trading visual polish for ease of use, structural clarity, and exploration of model-diagram mismatches. Other tools will (and should) explore different trade-offs.
CnD is embedded in an open-source visualizer for Forge. We encourage you to try it as part of your existing Forge workflows. To learn more about CnD, please read our paper!
Forge: A Tool to Teach Formal Methods
Tags: Education, Formal Methods, Properties, Tools, User Studies, Verification, Visualization
Posted on 21 April 2024.For the past decade we have been studying how best to get students into formal methods (FM). Our focus is not on the 10% or so of students who will automatically gravitate towards it, but on the “other 90%” who don’t view it as a fundamental part of their existence (or of the universe). In particular, we decided to infuse FM thinking into the students who go off to build systems. Hence the course, Logic for Systems.
The bulk of the course focuses on solver-based formal methods. In particular, we began by using Alloy. Alloy comes with numerous benefits: it feels like a programming language, it can “Run” code like an IDE, it can be used for both verification and state-exploration, it comes with a nice visualizer, and it allows lightweight exploration with gradual refinement.
Unfortunately, over the years we have also run into various issues with Alloy, a full catalog of which is in the paper. In response, we have built a new FM tool called Forge. Forge is distinguished by the following three features:
-
Rather than plunging students into the full complexity of Alloy’s language, we instead layer it into a series of language levels.
-
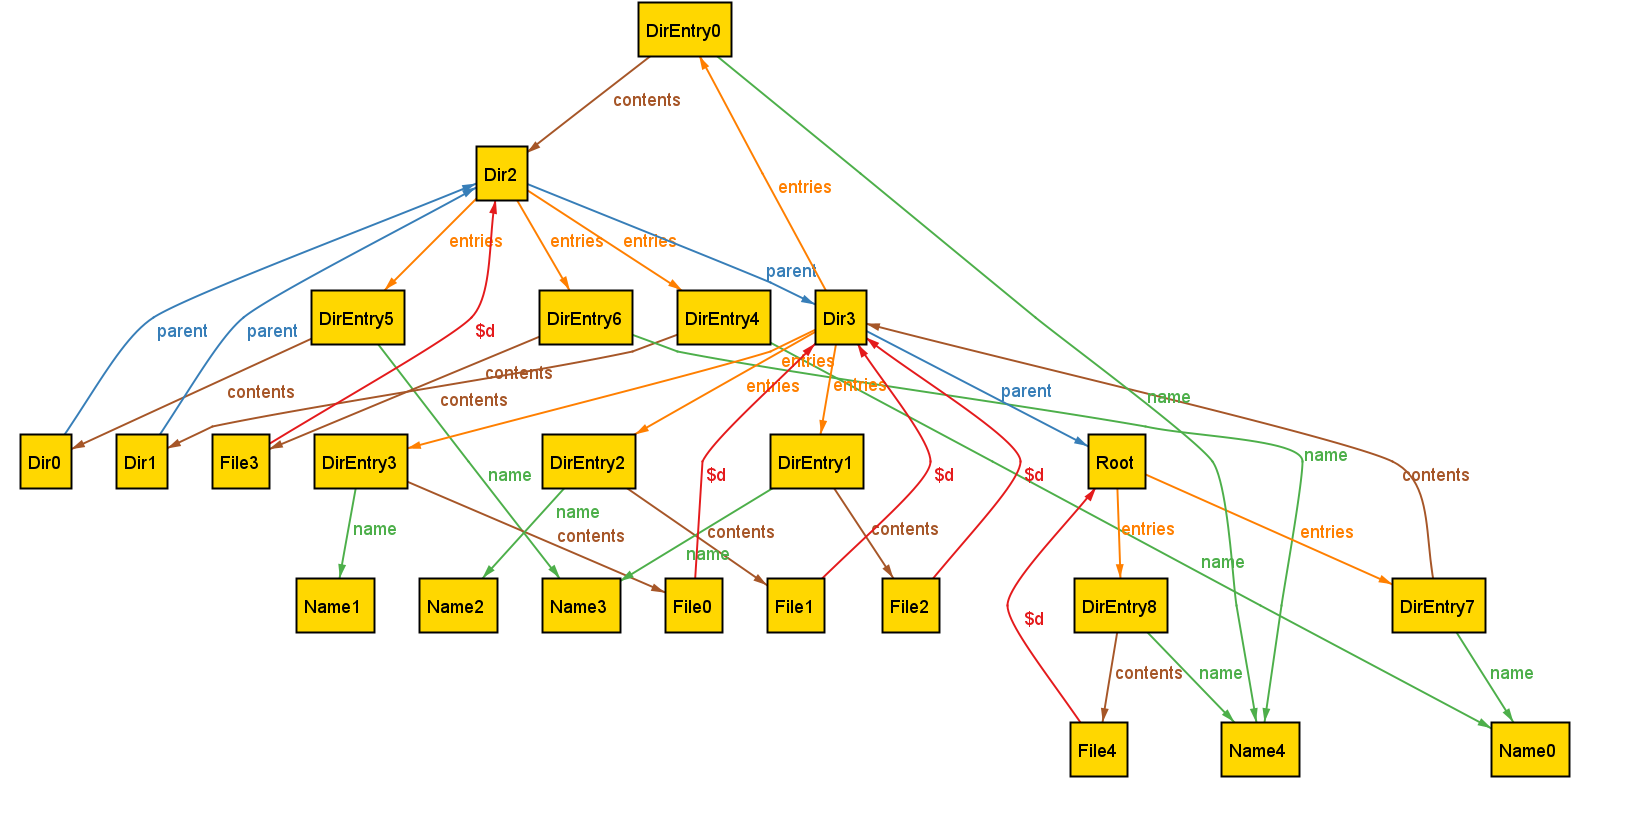
We use the Sterling visualizer by default, which you can think of as a better version of Alloy’s visualizer. But there’s much more! Sterling allows you to craft custom visualizations. We use this to create domain-specific visualizations. As we show in the paper, the default visualization can produce unhelpful, confusing, or even outright misleading images. Custom visualization takes care of these.
-
In the past, we have explored property-based testing as a way to get students on the road from programming to FM. In turn, we are asking the question, “What does testing look like in this FM setting?” Forge provides preliminary answers, with more to come.
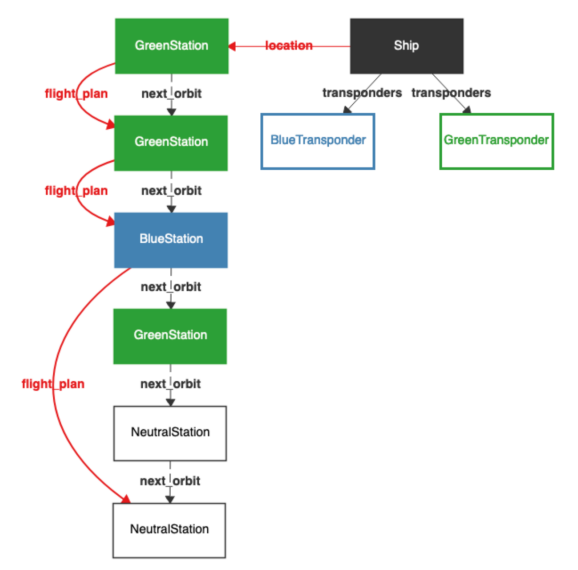
Just to whet your appetite, here is an example of what a default Sterling output looks like (Alloy’s visualizer would produce something similar, with fewer distinct colors, making it arguably even harder to see):
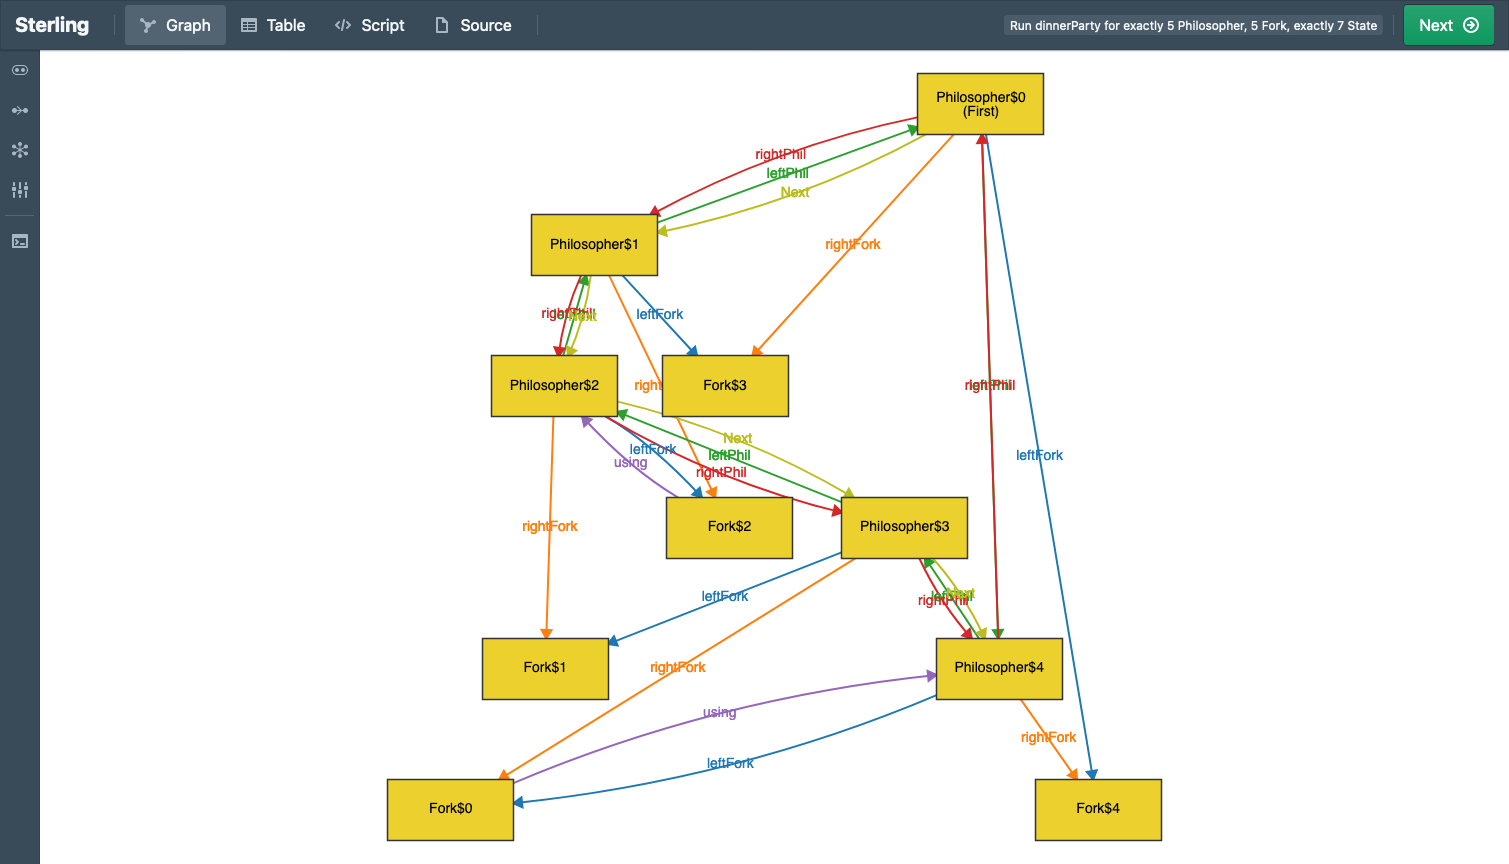
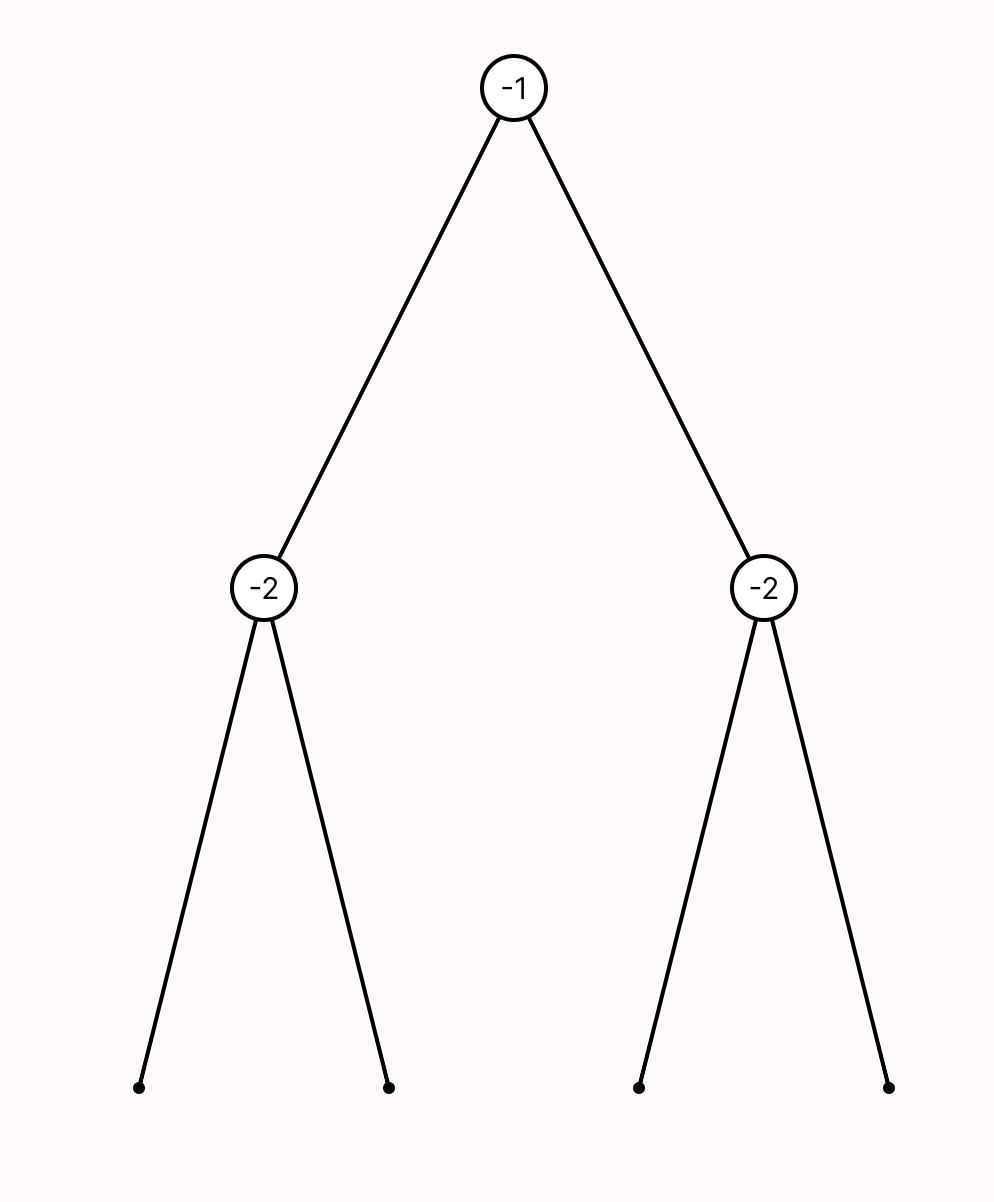
Here’s what custom visualization shows:
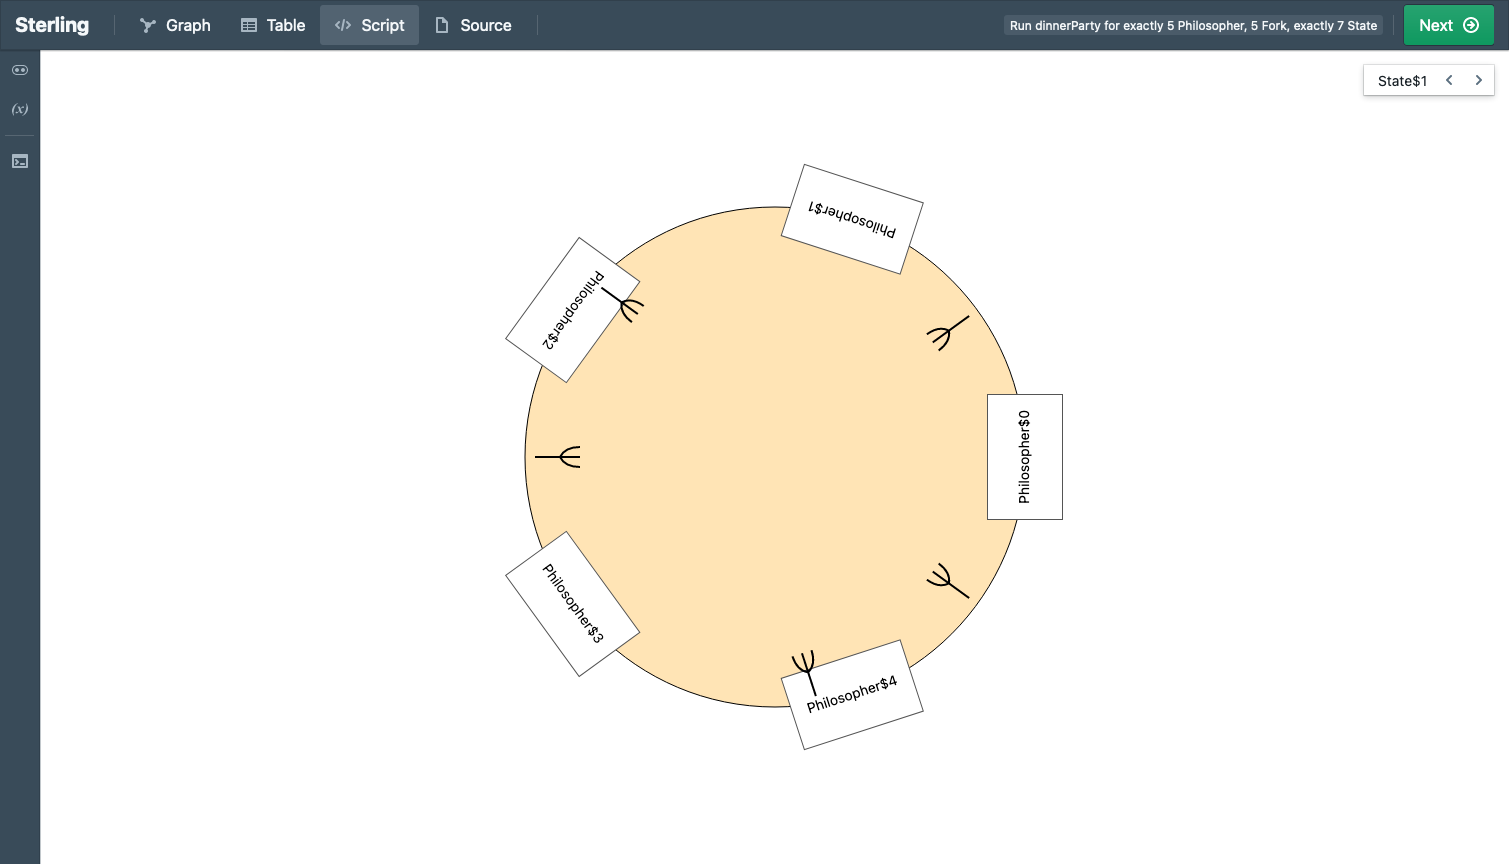
See the difference?
For more details, see the paper. And please try out Forge!
Acknowledgements
We are grateful for support from the U.S. National Science Foundation (award #2208731).
A Grounded Conceptual Model for Ownership Types in Rust
Tags: Crowdsourcing, Education, Rust, Types, User Studies, Visualization
Posted on 17 September 2023.Rust is establishing itself as the safe alternative to C and C++, making it an essential component for building a future software univers that is correct, reliable, and secure. Rust achieves this in part through the use of a sophisticated type system based on the concept of ownership. Unfortunately, ownership is unfamiliar to most conventionally-trained programmers. Surveys suggest that this central concept is also one of Rust’s most difficult, making it a chokepoint in software progress.
We have spent over a year understanding how ownership is currently taught, in what ways this proves insufficient for programmers, and looked for ways to improve their understanding. When confronted with a program containing an ownership violation, we found that Rust learners could generally predict the surface reason given by the compiler for rejecting the program. However, learners could often could not relate the surface reason to the underlying issues of memory safety and undefined behavior. This lack of understanding caused learners to struggle to idiomatically fix ownership errors.
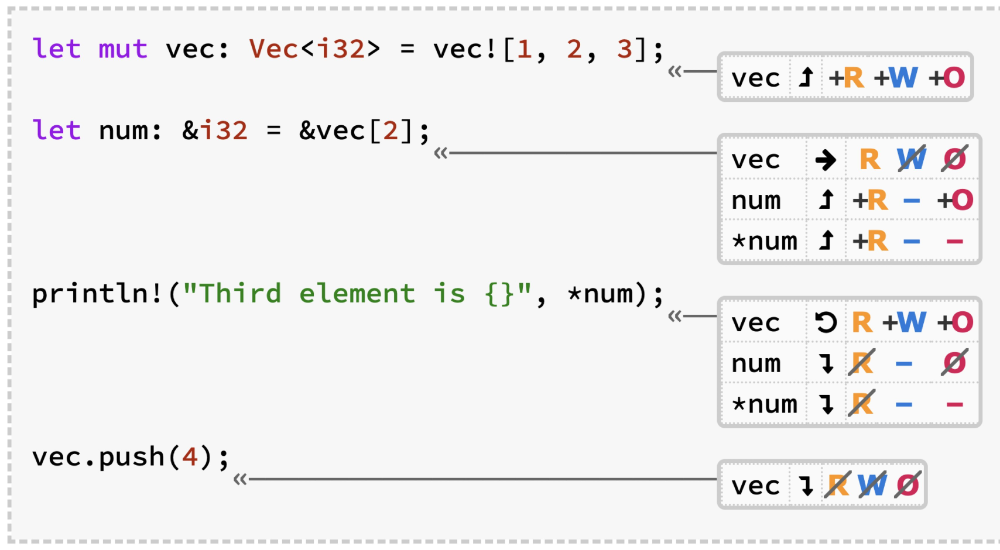
To address this, we created a new conceptual model for Rust ownership, grounded in these studies. We then translated this model into two new visualizations: one to explain how the type-system works, the other to illustrate the impact on run-time behavior. Crucially, we configure the compiler to ignore borrow-checker errors. Through this, we are able to essentially run counterfactuals, and thereby illustrate the ensuing undefined behavior.
Here is an example of the type-system visualization:
And here is an example of the run-time visualization:
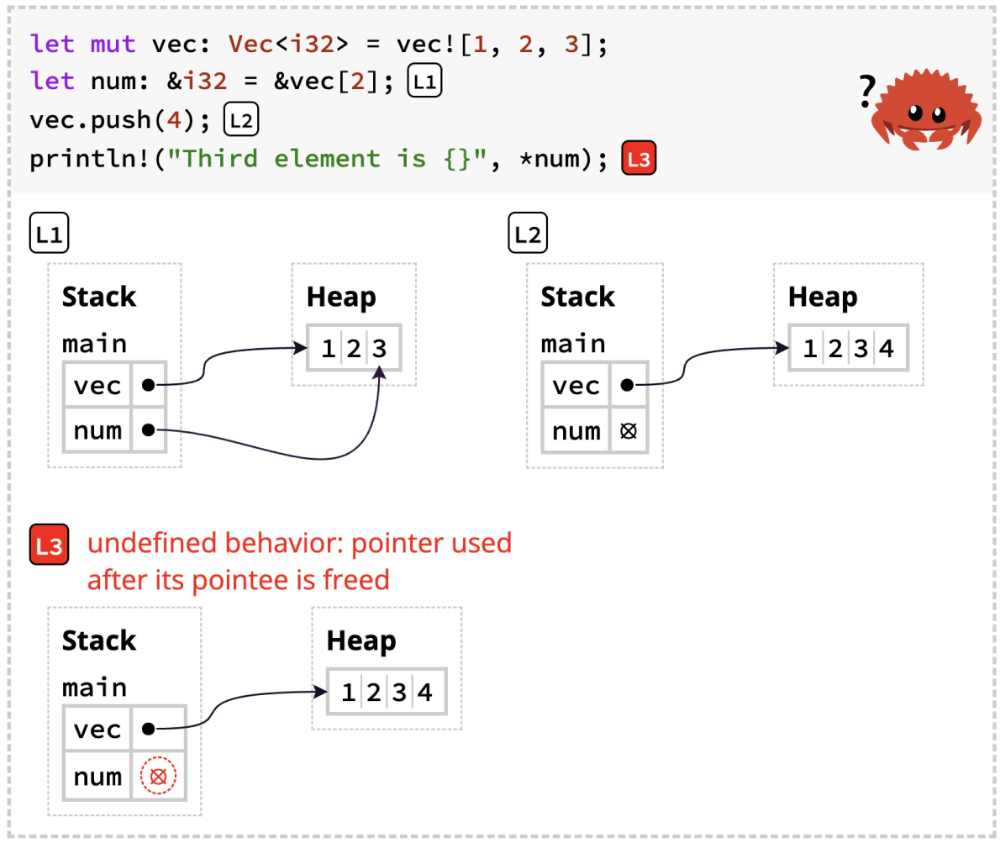
We incorporated these diagrams into an experimental version of The Rust Programming Language by Klabnik and Nichols. The authors graciously permitted us to create this fork and publicize it, and also provided a link to it from the official edition. As a result, we were able to test our tools on readers, and demonstrate that they do actually improve Rust learning.
The full details are in the paper. Our view is that the new tools are preliminary, and other researchers may come up with much better, more creative, and more effective versions of them. Rather, the main contribution is an understanding of how programmers do and don’t understand ownership, and in particular its relationship to undefined behavior. It is therefore possible that new pedagogies that make that connection clear may obviate the need for some of these tools entirely.
Applying Cognitive Principles to Model-Finding Output
Tags: User Studies, Verification, Visualization
Posted on 26 April 2022.Model-finders produce output to help users understand the specifications they have written. They therefore effectively make assumptions about how these will be processed cognitively, but are usually unaware that they are doing so. What if we apply known principles from cognitive science to try to improve the output of model-finders?
Model Finding and Specification Exploration
Model-finding is everywhere. SAT and SMT solvers are the canonical model-finders: given a logical specification, they generate a satisfying instance (a “model”) or report that it’s impossible. Their speed and generality have embedded them in numerous back-ends. They are also used directly for analysis and verification, e.g., through systems like Alloy.
One powerful modality enabled by tools like Alloy is the exploration of specifications. Usually, model-finders are used for verification: you have a specification and some properties about it, and a verifier tells you whether the properties are satisfied or not. However, we often don’t have properties; we just want to understand the consequences of a design. While a conventional verifier is useless in this setting, model-finders have no problem with it: they will generate models of the specification that show different possible ways in which it can be realized.
Presenting Exploration
The models generated by exploration (or even by verification, where they are typically counterexamples) can be presented in several ways. For many users, the most convenient output is visual. Here, for instance, is a typical image generated using the Sterling visualizer:
As of this writing, Alloy will let you sequentially view one model at a time.
Exploration for Understanding
The purpose of showing these models is to gain understanding. It is therefore reasonable to ask what forms of presentation would be most useful to enable the most understanding. In earlier work we studied details of how each model is shown. That work is orthogonal to what we do here.
Here, we are interested in how many models, and of what kind, should be displayed. We draw on a rich body of literature in perceptual psychology going back to seminal work by Gibson and Gibson in 1955. A long line of work since then has explored several dimensions of this, resulting in a modern understanding of contrasting cases. In this work, you don’t show a single result; rather, you show a set of similar examples, to better help people build models of what they are seeing. Since our goal is to help people understand a specification through visual output, it was natural to ask whether any of this literature could help in our setting.
Our Study
We concretely studied numerous experimental conditions involving different kinds of contrasting cases, where we show multiple models on screen at once. Critically, we looked at the use of both positive and negative models. Positive models are what you expect: models of the specification. In contrast, “negative” models are ones that don’t model the specification.
There can, of course, be an infinite number of negative models, most of which are of no use whatsoever: if I write a specification of a leader-election protocol, a whale or a sandwich are legitimate negative models. What we are interested in is “near miss” models, i.e., ones that could almost have been models but for a small difference. Our theory was that showing these models would help a user better understand the “space” of their model. (In this, we were inspired by prior work by Montaghmi and Rayside.)
Our Findings
We study these questions through both crowdsourced and talkaloud studies, and using both quantitative and qualitative methods. We find that in this setting, the use of multiple models does not seem to have been a big win. (Had it been, we would still have to confront the problem of how to fit all that information onto a screen in the general case.) The use of negative instances does seem to be helpful. We also constructed novel modes of output such as where a user can flip between positive and negative instances, and these seem especially promising.
Of course, our findings come with numerous caveats. Rather than think of our results as in any way definitive, we view this as formative work for a much longer line of research at the intersection of formal methods and human-computer interaction. We especially believe there is enormous potential to apply cognitive science principles in this space, and our paper provides some very rough, preliminary ideas of how one might do so.
For More Details
You can read about all this in our paper. Be warned, the paper is a bit of heavy going! There are a lot of conditions and lots of experiments and data. But hopefully you can get the gist of it without too much trouble.
Picking Colors for Pyret Error Messages
Tags: Pyret, Visualization
Posted on 11 June 2018.Pyret has beautiful error messages, like this one:
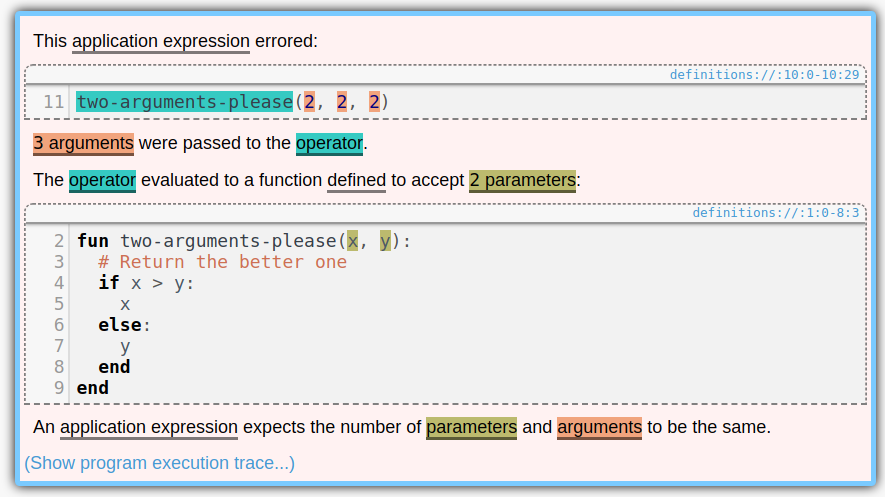
Notice the colors. Aren’t they pretty? Whenever a section of code is mentioned in an error message, it gets highlighted with its own color. And we pick colors that are as different as possible, so they don’t get confused with each other. It is useful to keep all of the colors distinct because it provides a very intuitive one-to-one mapping between parts of the code you wrote and the code snippets mentioned in the error messages. If two error messages used the same color for a snippet, it might look at first glance that they were mentioning the same thing.
(We should say up front: while we believe that the approach described in this post should be fairly robust to most forms of color blindness, it’s difficult to reason about so we make no guarantees. However, if two colors are hard to distinguish by sight, you can always hover over one of them to see the matching section of code blink. EDIT: Actually, it’s not as robust as we had hoped. If you know a good approach to this, let us know.)
How did we make them? It should be easy, right? We could have a list of, say, six colors and use those. After all, no error message needs more than six colors.
Except that there might be multiple error messages. In fact, if you have failing test cases, then you’ll have one failure message per failing test case, each with its own highlight, so there is no upper bound on how many colors we need. (Pyret will only show one of these highlights at a time—whichever one you have selected—but even so it’s nice for them to all have different colors.) Thus we’ll need to be able to generate a set of colors on demand.
Ok, so for any given run of the program, we’ll first determine how many colors we need for that run, and then generate that many colors.
Except that it’s difficult to tell how many colors we need beforehand. In fact, Pyret has a REPL, where users can evaluate expressions, which might throw more errors. Thus it’s impossible to know how many colors we’ll need beforehand, because the user can always produce more errors in the REPL.
Therefore, however we pick colors, it must satisfy these two properties:
- Distinctness: all of the colors in all of the highlights should be as visually different from each other as possible.
- Streaming: we must always be able to pick new colors.
Also, the appearance of the highlights should be pretty uniform; none of them should stand out too much:
- Uniformity: all of the colors should have the same saturation (i.e. colorfulness) and lightness as each other. This way none of them blend in with the background color (which is white) or the text color (which is black), or stand out too much.
The Phillotactic Color-Picking Algorithm
Now let’s talk about the algorithm we use!
(Note that this is “phillotactic”, not “phyllotactic”. It has nothing to do with plants.)
To keep uniformity, it makes sense to pick colors from a rainbow. This is a circle in color space, with constant saturation and lightness and varying hue. Which color space should we use? We should not use RGB, because that space doesn’t agree well with how colors actually appear. For example, if we used a rainbow in RGB space, then green would appear far too bright and blue would appear far too dark. Instead, we should use a color space that agrees with how people actually perceieve colors. The CIELAB color space is better. It was designed so that if you take the distance between two colors in it, that distance approximately agrees with how different the colors seem when you look at them. (It’s only approximate because—among other things—perceptual color space is non-Euclidean.)
Therefore we’ll pick colors from a circle in CIELAB space. This space
has three coordinates: L, for lightness, A for green-red, and B for
blue-yellow (hence the LAB). We determined by experimentation that a
good lightness to use was 73 out of 100. Given this lightness, we
picked the largest saturation possible, using A^2 + B^2 = 40^2.
Now how do we vary the hue? Every color picked needs a new hue, and they need to all be as different as possible. It would be bad, for instance, if we picked 13 colors, and then the 13th color looked just like the 2nd color.
Our solution was to have each color’s hue be the golden angle from the previous hue. From Wikipedia, the golden angle is “the angle subtended by the smaller arc when two arcs that make up a circle are in the golden ratio”. It is also 1/ϕ^2 of a circle, or about 137 degrees.
Thus the phillogenic algorithm keeps track of the number of colors generated so far, and assigns the n’th color a hue of n times the golden angle. So the first color will have a hue of 0 degrees. The second color will have a hue of 137 degrees. The third will have a hue of 137 * 2 = 274 degrees. The fourth will be 137 * 3 = 411 = 51 degrees. This is a little close to the first color. But even if we knew we’d have four colors total, they’d be at most 90 degrees apart, so 51 isn’t too bad. This trend continues: as we pick more and more colors, they never end up much closer to one another than is necessary.
There’s a reason that no two colors end up too similar. It follows from the fact that ϕ is the most difficult number to approximate as a fraction. Here’s a proof that colors aren’t similar:
Suppose that the m’th color and the (m+n)’th color end up being very similar. The difference between the m’th and (m+n)’th colors is the same as the difference between the 0’th and the n’th colors. Thus we are supposing that the 0’th color and the n’th color are very similar.
Let’s measure angles in turns, or fractions of 360 degrees. The n’th
color’s hue is, by definition, n/ϕ^2 % 1 turns. The 0’th hue is 0.
So if these colors are similar, then n/ϕ^2 % 1 ~= 0 (using ~=
for “approximately equals”). We can then reason as follows, using in
the third step the fact that ϕ^2 - ϕ - 1 = 0 so ϕ^2 = ϕ + 1:
n/ϕ^2 % 1 ~= 0
n/ϕ^2 ~= k    for some integer k
ϕ^2 ~= n/k
1 + ϕ ~= n/k
ϕ ~= (n-k)/k
Now, if n is small, then k is small (because n/k ~= ϕ^2), so
(n-k)/k is a fraction with a small denominator. But ϕ is difficult
to approximate with fractions, and the smaller the denominator the
worse the approximation, so ϕ actually isn’t very close to
(n-k)/k, so n/ϕ^2 % 1 actually isn’t very close to 0, so the
n’th color actually isn’t very similar to the 0’th color.
And that’s why the phillotactic colors work.
User Studies of Principled Model Finder Output
Tags: Crowdsourcing, Formal Methods, User Studies, Verification, Visualization
Posted on 01 July 2017.For decades, formal-methods tools have largely been evaluated on their correctness, completeness, and mathematical foundations while side-stepping or hand-waving questions of usability. As a result, tools like model checkers, model finders, and proof assistants can require years of expertise to negotiate, leaving knowledgeable but uninitiated potential users at a loss. This state of affairs must change!
One class of formal tool, model finders, provides concrete instances of a specification, which can guide a user’s intuition or witness the failure of desired properties. But are the examples produced actually helpful? Which examples ought to be shown first? How should they be presented, and what supplementary information can aid comprehension? Indeed, could they even hinder understanding?
We’ve set out to answer these questions via disciplined user-studies. Where can we find participants for these studies? Ideally, we would survey experts. Unfortunately, it has been challenging to do so in the quantities needed for statistical power. As an alternative, we have begun to use formal methods students in Brown’s upper-level Logic for Systems class. The course begins with Alloy, a popular model-finding tool, so students are well suited to participate in basic studies. With this population, we have found some surprising results that call into question some intuitively appealing answers to (e.g.) the example-selection question.
For more information, see our paper.
Okay, that’s student populations. But there are only so many students in a class, and they take the class only so often, and it’s hard to “rewind” them to an earlier point in a course. Are there audiences we can use that don’t have these problems? Stay tuned for our next post.
Resugaring Evaluation Sequences
Tags: Programming Languages, Resugaring, Semantics, Visualization
Posted on 06 February 2016.This is the first post in a series about resugaring. It focuses on resugaring evaluation sequences. See also our later posts on resugaring scope rules and resugaring type rules.
A lot of programming languages are defined in terms of syntactic sugar. This has many advantages, but also a couple of drawbacks. In this post, I’m going to tell you about one of these drawbacks, and the solution we found for it. First, though, let me describe what syntactic sugar is and why it’s used.
Syntactic sugar is when you define a piece of syntax in a language in
terms of the rest of the language. You’re probably already familiar
with many examples. For instance, in Python, x + y is syntactic
sugar for x.__add__(y). I’m going to use the word “desugaring”
to mean the expansion of syntactic sugar, so I’ll say that x + y
desugars to x.__add__(y). Along the same lines, in
Haskell, [f x | x <- lst] desugars to map f lst. (Well, I’m
simplifying a little bit; the full desugaring is given by the
Haskell 98 spec.)
As a programming language researcher I love syntactic sugar, and you should too. It splits a language into two parts: a big “surface” language that has the sugar, and a much smaller “core” language that lacks it. This separation lets programmers use the surface language that has all of the features they know and love, while letting tools work over the much simpler core language, which lets the tools themselves be simpler and more robust.
There’s a problem, though (every blog post needs a problem). What happens when a tool, which has been working over the core language, tries to show code to the programmer, who has been working over the surface? Let’s zoom in on one instance of this problem. Say you write a little snippet of code, like so: (This code is written in an old version of Pyret; it should be readable even if you don’t know the language.)
my-list = [2]
cases(List) my-list:
  | empty() => print("empty")
  | link(something, _) =>
    print("not empty")
end
And now say you’d like to see how this code runs. That is, you’d like to see an evaluation sequence (a.k.a. an execution trace) of this program. Or maybe you already know what it will do, but you’re teaching students, and would like to show them how it will run. Well, what actually happens when you run this code is that it is first desugared into the core, like so:
my-list = list.["link"](2, list.["empty"])
block:
  tempMODRIOUJ :: List = my-list
  tempMODRIOUJ.["_match"]({
    "empty" : fun(): print("empty") end,
    "link" : fun(something, _):
      print("not empty") end
},
fun(): raise("cases: no cases matched") end)
end
This core code is then run (each block of code is the next evaluation step):
my-list = obj.["link"](2, list.["empty"])
block:
tempMODRIOUJ :: List = my-list
  tempMODRIOUJ.["_match"]({"empty" : fun():   print("empty") end,
  "link" : fun(something, _):   print("not empty") end}, fun():
  raise("cases: no cases matched") end)
  end

my-list = obj.["link"](2, list.["empty"])
block:
tempMODRIOUJ :: List = my-list
  tempMODRIOUJ.["_match"]({"empty" : fun():   print("empty") end,
  "link" : fun(something, _):   print("not empty") end}, fun():
  raise("cases: no cases matched") end)
  end

my-list = <func>(2, list.["empty"])
block:
tempMODRIOUJ :: List = my-list
  tempMODRIOUJ.["_match"]({"empty" : fun():   print("empty") end,
  "link" : fun(something, _):   print("not empty") end}, fun():
  raise("cases: no cases matched") end)
  end

my-list = <func>(2, obj.["empty"])
block:
tempMODRIOUJ :: List = my-list
  tempMODRIOUJ.["_match"]({"empty" : fun():   print("empty") end,
  "link" : fun(something, _):   print("not empty") end}, fun():
  raise("cases: no cases matched") end)
  end

my-list = <func>(2, obj.["empty"])
block:
tempMODRIOUJ :: List = my-list
  tempMODRIOUJ.["_match"]({"empty" : fun():   print("empty") end,
  "link" : fun(something, _):   print("not empty") end}, fun():
  raise("cases: no cases matched") end)
  end

my-list = <func>(2, [])
block:
tempMODRIOUJ :: List = my-list
  tempMODRIOUJ.["_match"]({"empty" : fun():   print("empty") end,
  "link" : fun(something, _):   print("not empty") end}, fun():
  raise("cases: no cases matched") end)
  end

my-list = [2]
block:
tempMODRIOUJ :: List = my-list
  tempMODRIOUJ.["_match"]({"empty" : fun():   print("empty") end,
  "link" : fun(something, _):   print("not empty") end}, fun():
  raise("cases: no cases matched") end)
  end

tempMODRIOUJ :: List = [2]
tempMODRIOUJ.["_match"]({"empty" : fun(): print("empty") end, "link" :
fun(something, _): print("not empty") end}, fun(): raise("cases: no
cases matched") end)

[2].["_match"]({"empty" : fun(): print("empty") end, "link" :
fun(something, _): print("not empty") end}, fun(): raise("cases: no
cases matched") end)

[2].["_match"]({"empty" : fun(): print("empty") end, "link" :
fun(something, _): print("not empty") end}, fun(): raise("cases: no
cases matched") end)

<func>({"empty" : fun(): end, "link" : fun(something, _): print("not
empty") end}, fun(): raise("cases: no cases matched") end)

<func>({"empty" : fun(): end, "link" : fun(): end}, fun():
raise("cases: no cases matched") end)

<func>(obj, fun(): raise("cases: no cases matched") end)

<func>(obj, fun(): end)

<func>("not empty")

"not empty"
But that wasn’t terribly helpful, was it? Sometimes you want to see exactly what a program is doing in all its gory detail (along the same lines, it’s occasionally helpful to see the assembly code a program is compiling to), but most of the time it would be nicer if you could see things in terms of the syntax you wrote the program with! In this particular example, it would be much nicer to see:
my-list = [2]
cases(List) my-list:
  | empty() => print("empty")
  | link(something, _) =>
    print("not empty")
end

my-list = [2]
cases(List) my-list:
  | empty() => print("empty")
  | link(something, _) =>
    print("not empty")
end

cases(List) [2]:
| empty() => print("empty")
| link(something, _) =>
  print("not empty")
end

<func>("not empty")

"not empty"
(You might have noticed that the first step got repeated for what
looks like no reason. What happened there is that the code [2]
was evaluated to an actual list, which also prints itself as [2].)
So we built a tool that does precisely this. It turns core evaluation sequences into surface evaluation sequences. We call the process resugaring, because it’s the opposite of desugaring: we’re adding the syntactic sugar back into your program. The above example is actual output from the tool, for an old version of Pyret. I’m currently working on a version for modern Pyret.
Resugaring Explained
I always find it helpful to introduce a diagram when explaining resugaring. On the right is the core evaluation sequence, which is the sequence of steps that the program takes when it actually runs. And on the left is the surface evaluation sequence, which is what you get when you try to resugar each step in the core evaluation sequence. As a special case, the first step on the left is the original program.
Here’s an example. The starting program will be not(true) or true, where
not is in the core language, but or is defined as a piece of
sugar:
x or y    ==desugar==>  let t = x in
                          if t then t else y
And here’s the diagram:
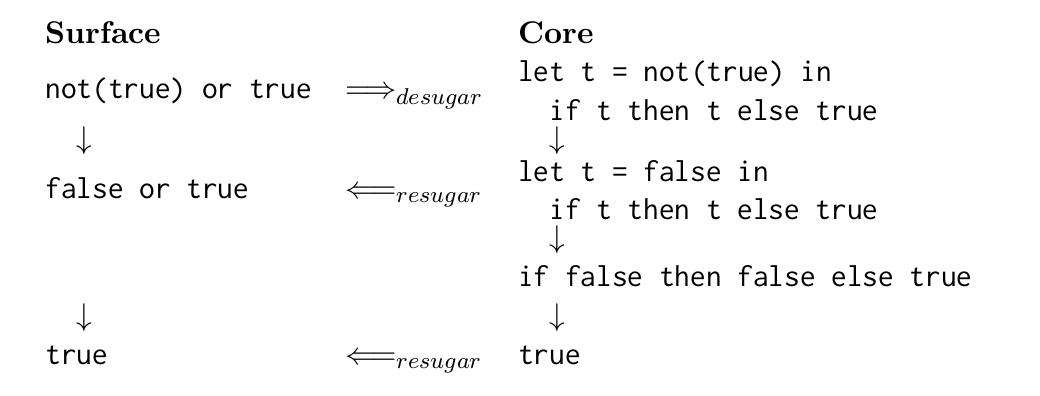
The steps (downarrows) in the core evaluation sequence are ground
truth: they are what happens when you actually run the program. In
contrast, the steps in the surface evaluation sequence
are made up; the whole surface evaluation sequence is an attempt at
reconstructing a nice evaluation sequence by resugaring each of the
core steps. Notice that the third core term fails to resugar. This is
because there’s no good way to represent it in terms of or.
Formal Properties of Resugaring
It’s no good to build a tool without having a precise idea of what it’s supposed to do. To this end, we came up with three properties that (we think) capture exactly what it means for a resugared evaluation sequence to be correct. It will help to look at the diagram above when thinking about these properties.
-
Emulation says that every term on the left should desugar to the term to its right. This expresses the idea that the resugared terms can’t lie about the term they’re supposed to represent. Another way to think about this is that desugaring and resugaring are inverses.
-
Abstraction says that the surface evaluation sequence on the left should show a sugar precisely when the programmer used it. So, for example, it should show things using
orand notlet, because the original program usedorbut notlet. -
Coverage says that you should show as many steps as possible. Otherwise, technically the surface evaluation sequence could just be empty! That would satisfy both Emulation and Abstraction, which only say things about the steps that are shown.
We’ve proved that our resugaring algorithm obeys Emulation and Abstraction, and given some good emperical evidence that it obeys Coverage too.
I’ve only just introduced resugaring. If you’d like to read more, see the paper, and the followup that deals with hygiene (e.g., preventing variable capture).