The Brown PLT Blog

Articles by tag: Tables
Adding Function Transformers to CODAP
A Benchmark for Tabular Types
Tags: Programming Languages, Pyret, Semantics, Tables, Types
Posted on 21 November 2021.Tables are Everywhere
Tables are ubiquitous in the world. Newspapers print tables. Reports include tables. Even children as young as middle-school work comfortably with tables. Tables are, of course, also ubiquitous in programming. Because they provide an easy-to-understand, ubiquitous, already-parsed format, they are also valuable in programming education (e.g., DCIC works extensively with tables before moving on to other compound datatypes).
(Typed) Programming with Tables
When it comes to programming with tables, we have excellent tools like relational databases. However, using external databases creates impedance mismatches, so many programmers like to access tabular data from directly in the language, rather than construct external calls. The popularity of language-embedded query has not diminished with time.
Programming with tables, however, requires attention to types. Tables are inherently heterogeneous: each column is welcome to use whatever type makes most sense. This is all the more so if tables are a part of the language itself: while external data tend to be limited to “wire-format” types like numbers and strings, inside the language they can contain images, functions, other tables, and more. (For instance, we use all of these in Pyret.)
What is the type of a table? To make the output of tabular operations
useful, it can’t be something flat like just Table. Because tables
are heterogenous, they can’t have just a single type parameter (like
Table<T>). It may conceptually make sense to have a type parameter
for each column (e.g., Table<String, Number>), but real-world tables
can have 17 or 37 columns! Programmers also like to access table
columns by name, not only position. And so on.
Making Results Comparable
In Spring 2021, we ran a seminar to understand the state of knowledge of type systems for tables. While we read several excellent papers, we also came away very frustrated: authors simply did not seem to agree on what a “table” was or what operations to support. The result was an enormous degree of incommensurability.
Therefore, rather than invent Yet Another Tabular Type System, we decided to take a step back and address the incommensurability problem. What we need as a community is a shared, baseline understanding of several aspects of tables. That is what this work does: create a tables benchmark. This is not a performance benchmark, however; rather, it’s an expressivity and design benchmark. We call it B2T2: The Brown Benchmark for Tabular Types.
The benchmark doesn’t spring out of thin air. Rather, we extensively studied tabular support in widely-used industrial languages/libraries: R, Python/Pandas, and Julia. To cover educational needs, we also studied the Pyret-based Bootstrap:Data Science curriculum. You will notice that all are based on dynamic languages. (Though Pyret has an optional static type system, it currently does not support tables in any meaningful manner, so tabular programming is essentially dynamic.) This is intentional! If you start with a typed language, you end up reflecting the (potentially artificial and overly-restrictive) constraints of that type system. Rather, it’s healthy to study what programmers (seem to) want to say and do, filter these for reasonability, and reconcile that with the needs of static types (like decidability).
Do Now!
What do you expect to find in a tabular programming benchmark?
Make a list before you read on!
Benchmark Components
B2T2 has the following parts:
-
A definition of a table. There is actually a large space of possibilities here. We’ve chosen a definition that is both broad and interesting without being onerous.
-
Examples of tables. Why did we bother to provide these? We do so because many type systems may have all sorts of internal encodings. They are welcome to do so, but they cannot expect the outside world to conform to their representation. Therefore, these examples represent the canonical versions of these tables. Explaining how these will be converted to the internal format is the responsibility of the type system designers.
-
An API of table operations. This is of course the heart of the benchmark. In particular, different papers seem to use different subsets of operations. What is unclear is whether the missing operations are just as easy as the ones shown; difficult; or even impossible. This is therefore a big source of incommensurability.
-
Example programs. Depending on the representation of tables and the nature of the type systems and languages, these programs may have to be rewritten and may (to some observers) look quite unnatural.
All these might be predictable with some thought. There are two more components that may be a little more surprising:
-
Erroneous programs. In all sophisticated systems, there is a trade-off between complexity and explainability. We are disturbed by how little discussion there is of error-reporting in the papers we’ve read, and think the community should re-balance its emphasis. Even those who only care about technical depth (boo!) can take solace: there can be rich technical work in explaining errors, too! Furthermore, by making errors an explicit component, a team that does research into human factors—even if they leave all other aspects alone—has a “place to stand” to demonstrate their contribution.
-
A datasheet. To improve commensurability, we want authors to tell each other—and their users—in a standard format not only what they did but also where the bodies are buried.
Of course, all these parts are interesting even in the absence of types. We just expect that types will impose the most interesting challenges.
An Open Process
We expect this benchmark to grow and evolve. Therefore, we’ve put our benchmark in a public repository. You’re welcome to make contributions: correct mistakes, refine definitions, add features, provide more interesting examples, etc. You can also contribute solutions in your favorite language!
For More Details
You can read about all this in our paper and work with our repository.
Adding Function Transformers to CODAP
Tags: Higher-Order Functions, Education, Tables, Tools
Posted on 22 August 2021.CODAP is a wonderful tool for data transformation. However, it also has important limitations, especially from the perspective of our curricula. So we’ve set about addressing them so that we can incorporate CODAP into our teaching.
CODAP
We at Brown PLT and Bootstrap are big fans of CODAP, a data-analysis tool from the Concord Consortium. CODAP has very pleasant support for working with tables and generating plots, and we often turn to it to perform a quick analysis and generate a graph.
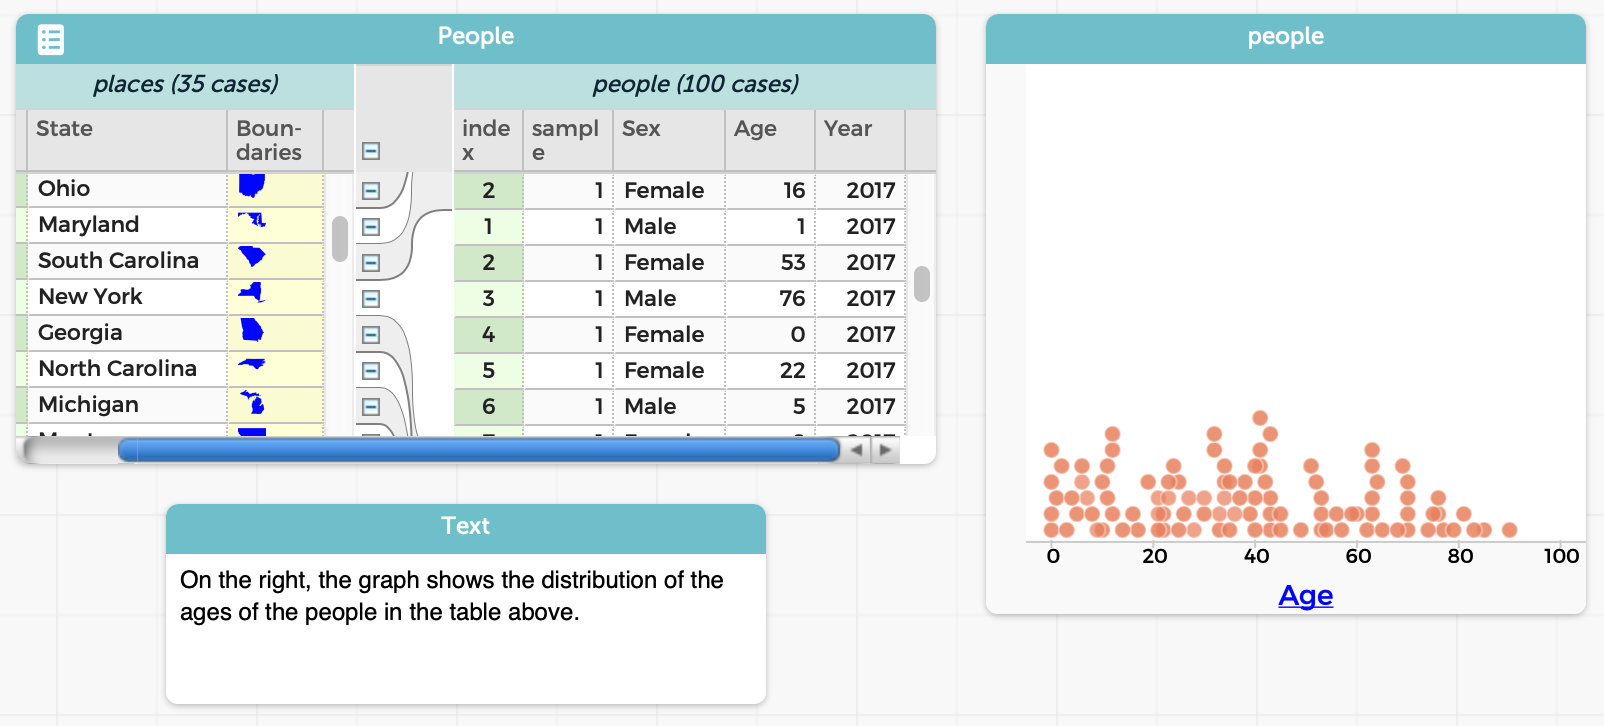
One of the nice things about CODAP, that sets it apart from traditional spreadsheets, is that the basic unit of space is not a table or spreadsheet but a desktop that can contain several objects on it. A workspace can therefore contain many objects side-by-side: a table, a graph, some text, etc.:
Also, a lot of things in CODAP are done through direct manipulation. This is helpful for younger students, who may struggle with formal programming but can use a GUI to manipulate objects.
There are many other nice features in CODAP, such as the ability to track a data case cross representations, and so on. We urge you to go try it out! When you launch a new CODAP instance, CODAP will offer you a folder of examples, which can help you get acquainted with it and appreciate its features.
What’s Not to Love?
Unfortunately, we don’t love everything about CODAP. We’ll illustrate with an example. To be clear, this is not a bug in CODAP, but rather an important difference of opinion in ease-of-use.
Let’s say we want to find all the people who are below 50 years of age. In CODAP, there are a few ways to do it, all of which have their issues.
If you don’t mind being imprecise (which may be okay for a quick data exploration, but isn’t if you want to, say, compute a statistic over the result):
- Create a new graph.
- Drag the
Agecolumn to the graph. - Select all the items that are under 50 using visual inspection. (Depending on how much data you have and their spread, you’ll quite possibly under- and/or over-shoot.)
- Then do the last few steps below.
If you care to get an accurate selection, instead begin with:
- First, add a new column to the original table.
- Enter a formula for that column (in this case,
Age < 50). - Obtain a selection of the desired items, which can be done in several different ways, also all with trade-offs:
-
Sort by that column. Unfortunately, this won’t work if there’s grouping in the table. You’d have to select manually. (Try it. This may be a bit harder than it seems.)
-
Create a graph as above, but of the new column. This will give you a clean separation into two values. Manually select all the values in the
truecolumn. At least now it will be visually clear if you didn’t select all the right values (if the dataset is not too large). -
Remove the formula for the new column. Now drag it to the leftmost end of the table. (If you don’t remove the formula, you’ll get an error!) Now you have all the elements grouped by
trueandfalse(and operations performed to one can also be performed to the other).
You’re not done! You still have more steps to go:
- If you aren’t already in the table (e.g., if you made a graph), select the table.
- Click on the “Eye” icon.
- Choose the “Set Aside Unselected Cases” entry.
Note that, in most or all of these cases:
- You’ve added a completely superfluous column to your dataset.
- You may have changed the order of items in your dataset.
- You’ve lost the ability to see the original data alongside the filtered data.
- You had to take numerous steps.
- You had to remember to use the Eye icon for filtering, as opposed to other GUI operations for other tasks.
- You had to remember where the Eye icon even is: it’s hidden when a table isn’t selected.
But most of all, in every single case:
- You had to perform all these operations manually.
Why does this matter? We need data science to be reproducible: we should be able to give others our datasets and scripts so they can re-run them to check that they get the same answer, tweak them so they can check the robustness of our answers, and so on. But when all the operations are done manually, there’s no “script”, only output. That focuses on answers rather than processes, and is anti-reproducibility.
In contrast, we think of filtering as a program operation that we apply to a table to produce a new table, leaving the original intact: e.g., the way it works in Pyret. This addresses almost all of the issues above.
Other Pedagogic Consequences
CODAP had to make certain design choices. They made good choices for some settings: for younger children, in particular, the direct manipulation interface works very nicely. It’s a low floor. However, we feel it’s also a lower-than-we’d-like ceiling. There are many things that the CODAP view of data transformation inhibits:
- Making operations explicit, as we noted above.
- Introducing the idea of functions or transformations of data as objects in their own right, not only as manual operations.
- Having explicit data-transformation functions also connects to other related school curricula, such as algebra.
- Saving and naming repeated operations, to learn a bottom-up process of developing abstractions.
- Examining old and new tables side-by-side.
This last point is especially important. A critical task in data science is performing “what if” analyses. What-if fundamentally means we should be able to perform some operation (the “if” part) and compare the output (the “what” part). We might even want to look at multiple different scenarios, representing different possible outcomes. But traditional what-if analysis, whether in CODAP or on spreadsheets, often requires you, the human, to remember what has changed, rather than letting the computer do it for you. (Microsoft Excel has limited support to get around this, but its very presence indicates that spreadsheets, traditionally, did not support what-if analysis—even though that’s how they have often been marketed.)
Finally, there’s also a subtle consequence to CODAP’s design: derived tables must look substantially similar to their parents. In computing terms, the schema should be largely the same. That works fine when an operation has little impact on the schema: filtering doesn’t change the schema at all (in principle, though in CODAP you have to add an extra column…), and adding a new column is a conservative extension. But what if you want to perform an operation that results in a radically different schema? For instance, consider the “pivot wider” and “pivot longer” operations when we create tidy data. The results of those operations have substantially different schemas!
Introducing CODAP Transformers
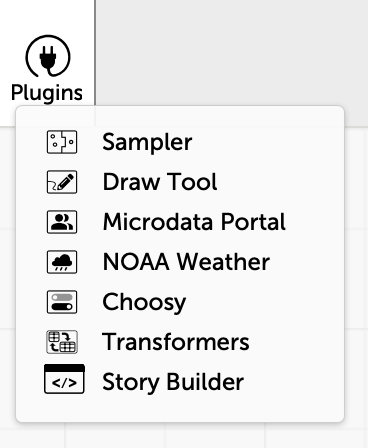
In response to this critique, we’ve added a new plugin to CODAP called Transformers:
(This work was done by undergrad trio Paul Biberstein, Thomas Castleman, and Jason Chen.)
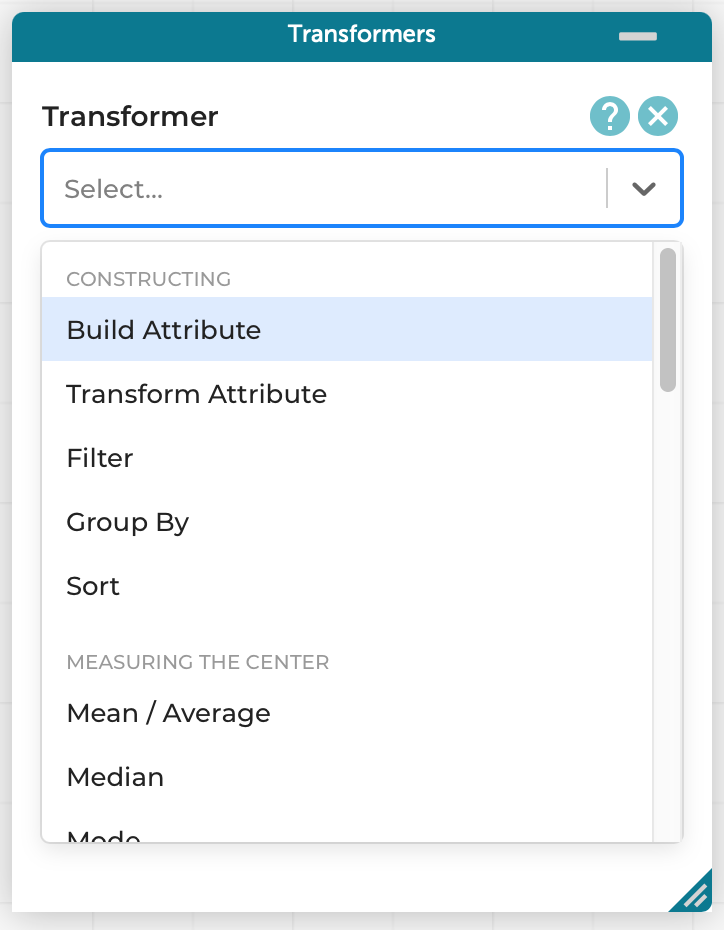
This introduces a new pane that lists several transformation operations, grouped by functionality:
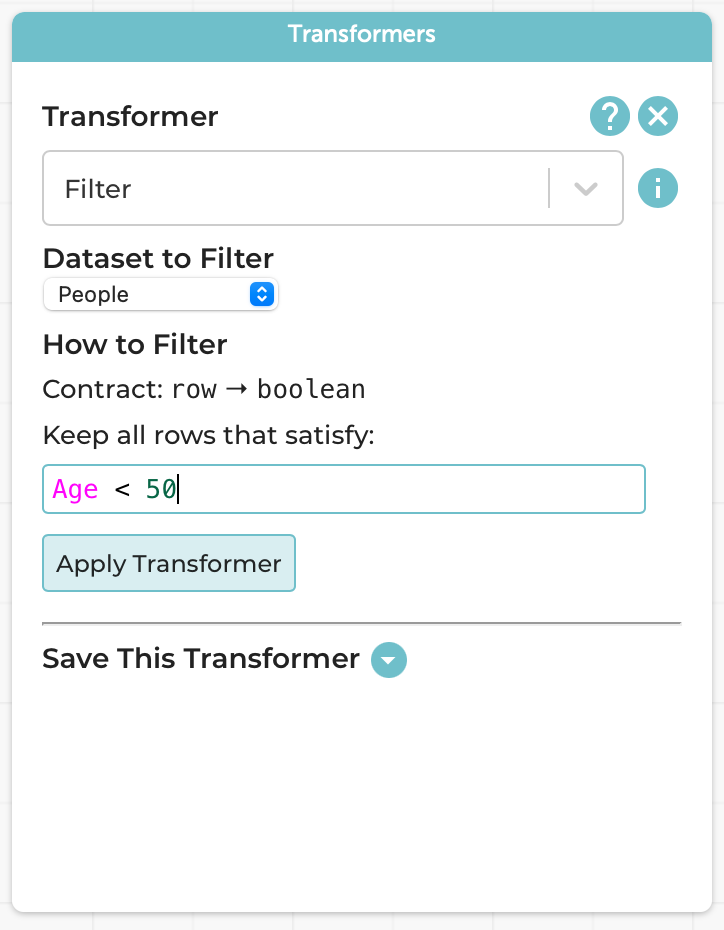
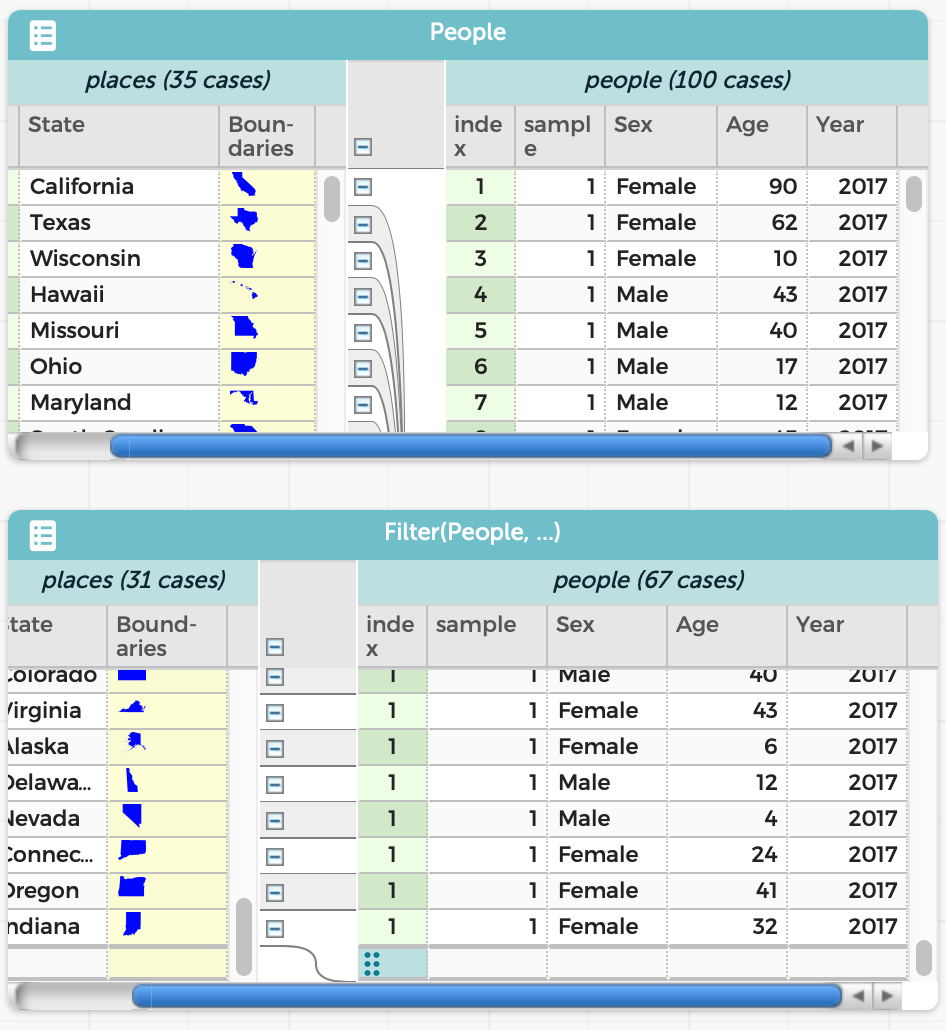
For instance, with no more textual programming than before (the formula is the same), we can perform our same example as before, i.e., finding all the people younger than 50:
The result is a new table, which co-exists with the original:
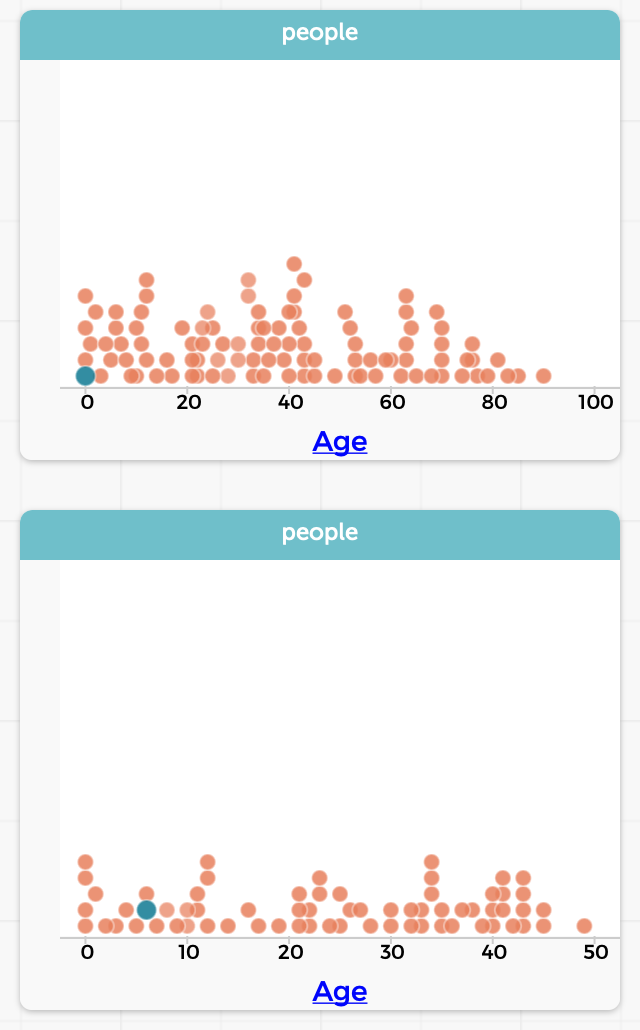
The resulting table is just as much a table as the original. For instance, we can graph the ages in the two tables and see exactly the difference we’d expect:
(Over time, of course, you may build up many tables. The Transformers plugin chooses names based on the operations, to make them easy to tell apart. CODAP also lets you resize, minimize, and delete tables. In practice, we don’t expect users to have more than 3–4 tables up at a time.)
Saving Transformers
We might want to perform the same operation on multiple tables. This is valuable in several contexts:
-
We create a hand-curated table, with known answers, as a test case to make sure our operations perform what we expect. After confirming this, we want to be sure that we applied the exact same operation to the real dataset.
-
We want to perform the same operation to several related datasets: e.g., a table per year.
We might also simply want to give a meaningful name to the operation.
In such cases, we can use the “Save This Transformer” option at the bottom of the Transformers pane:
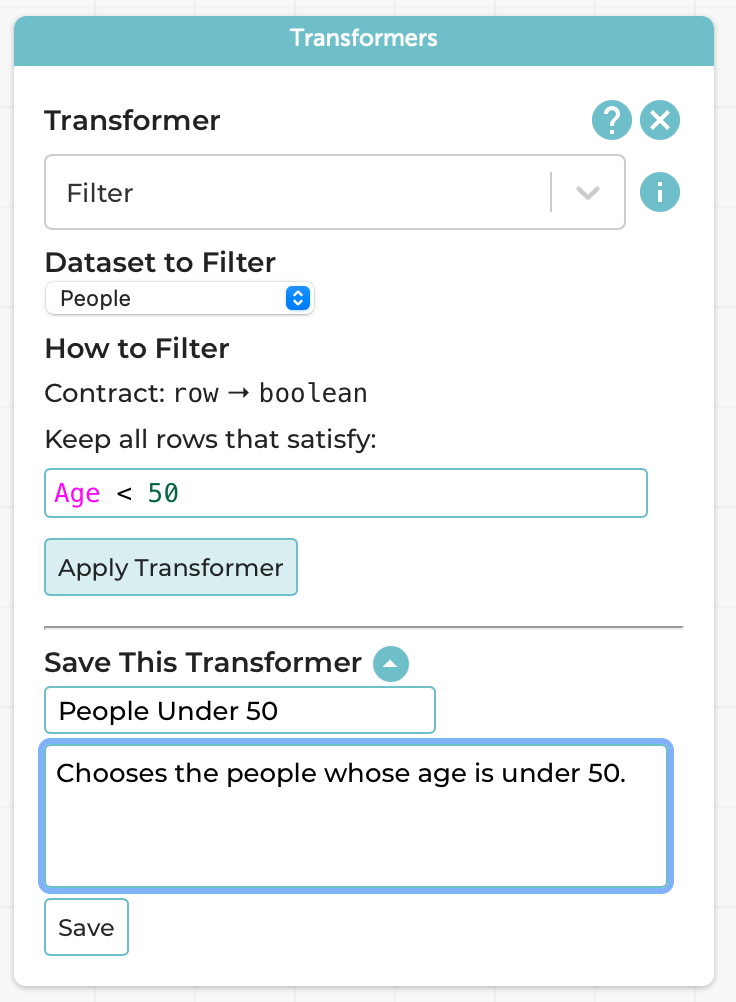
Following the programming processes we follow and teach, we naturally want you to think about the Design Recipe steps when saving it because, in programming terms, you’re creating a new function.
This now creates a new named transformer:
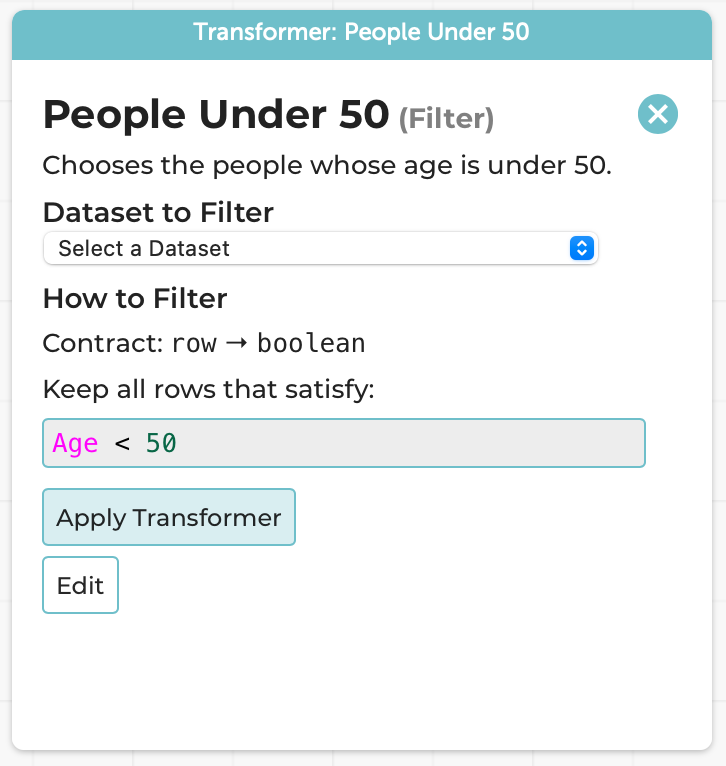
Every part of this is frozen other than the choice of dataset; it can be applied as many times as you want, to as many datasets as you want. The above use-cases are suggestions, but you can use it however you wish.
A Note on Errors
Suppose you try to apply an operation improperly. Say, for instance, you have a table of people that does not have an Age column, and you try to filter people with Age < 50. There are at least two choices that Transformers can take:
-
Allow you to try to perform the operation, and report an error.
-
Prevent you from even trying by simply not showing tables that are invalid in the drop-down list of tables that the operation can be applied to.
We know exactly what the programming languages reader reading this is thinking: “You’re going to choose the latter, right? Right?!? PLEASE TELL ME YOU ARE!!!”
Gentle Reader: we’re not.
Here’s why we chose not to.
- There’s the messy implementation detail of figuring out exactly when a table should or shouldn’t be shown in the drop-down. And we’d have to maintain that across changes to the CODAP language. There are no such problems in the dynamic version.
But hey, we’re language implementors, we can figure these things out. Rather, our real reason comes from human factors:
- Imagine you’re a teacher with a classroom full of students. A student tries to apply an operation to the wrong table. They probably don’t even realize that the operation can’t be applied. All they know is that the table doesn’t appear in the list. Their table doesn’t appear in the list! Their reaction is (perhaps rightly) going to be to raise their hand and say to their teacher, “This tool is broken! It won’t even show me my table!!!” And the teacher, dealing with a whole bunch of students, all in different states, may not immediately realize why the table doesn’t show. Everyone’s frustrated; the student feels stuck, and the teacher may be left feeling inadequate.
In contrast, if we just let the operation happen, here’s what the student sees:
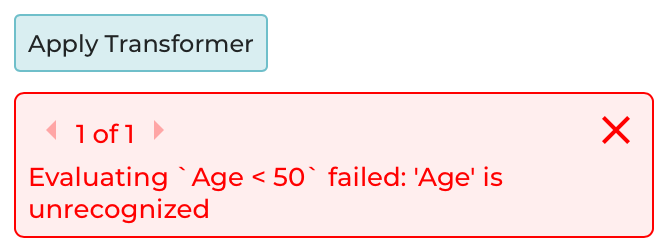
Now the student has a pretty good chance of figuring out for themselves what went wrong: not pulling away the teacher from helping someone else, not blaming the tool, and instead giving themselves a chance of fixing their own problem.
There’s potentially a broader lesson here about making invalid states unrepresentable. Potentially.
Many, Many Transformers!
We’ve focused on just one transformation here. There are many more. We even have the pivoting operations for tidy data! (It would have been wrong to tease you with that up top, otherwise.)
We even take the what-if part seriously: the Compare Transformer lets you compare numeric and categorical data. Believe it or not, the categorical comparison operator was actually inspired by prior work we’ve done for many years on comparing access control policies, router configurations, and SDN programs (see also our two brief position papers). It’s pretty thrilling to see the flow of ideas from security and networking research to data science education in a small but very non-obvious way: the grouping in the categorical output is directly inspired by the multi-terminal decision diagrams of our original Margrave system. For more on this line of work, see our blog post.
Examples
For your benefit, we’ve set up a bunch of pre-built CODAP examples that show you the operations in action:
- Building attributes, Filtering, and Updating data
- Partition
- Filter, Running Sum, and their interaction
- Transformers that produce single values
- Reusing saved transformers
- Categorical Compare
- Numerical Compare
- Pivot operations from tidy data
Make Your Own!
As you might have guessed from the examples above, transformers are now part of the official CODAP tool. You can go play with them right now on the CODAP site. Have fun! Tell us what you learned.
Thanks
Special thanks to our friends at the Concord Consortium, especially William Finzer, Jonathan Sandoe, and Chad Dorsey, for their support.