The Brown PLT Blog

Forge: A Tool to Teach Formal Methods
Tags: Education, Formal Methods, Properties, Tools, User Studies, Verification, Visualization
Posted on 21 April 2024.For the past decade we have been studying how best to get students into formal methods (FM). Our focus is not on the 10% or so of students who will automatically gravitate towards it, but on the “other 90%” who don’t view it as a fundamental part of their existence (or of the universe). In particular, we decided to infuse FM thinking into the students who go off to build systems. Hence the course, Logic for Systems.
The bulk of the course focuses on solver-based formal methods. In particular, we began by using Alloy. Alloy comes with numerous benefits: it feels like a programming language, it can “Run” code like an IDE, it can be used for both verification and state-exploration, it comes with a nice visualizer, and it allows lightweight exploration with gradual refinement.
Unfortunately, over the years we have also run into various issues with Alloy, a full catalog of which is in the paper. In response, we have built a new FM tool called Forge. Forge is distinguished by the following three features:
-
Rather than plunging students into the full complexity of Alloy’s language, we instead layer it into a series of language levels.
-
We use the Sterling visualizer by default, which you can think of as a better version of Alloy’s visualizer. But there’s much more! Sterling allows you to craft custom visualizations. We use this to create domain-specific visualizations. As we show in the paper, the default visualization can produce unhelpful, confusing, or even outright misleading images. Custom visualization takes care of these.
-
In the past, we have explored property-based testing as a way to get students on the road from programming to FM. In turn, we are asking the question, “What does testing look like in this FM setting?” Forge provides preliminary answers, with more to come.
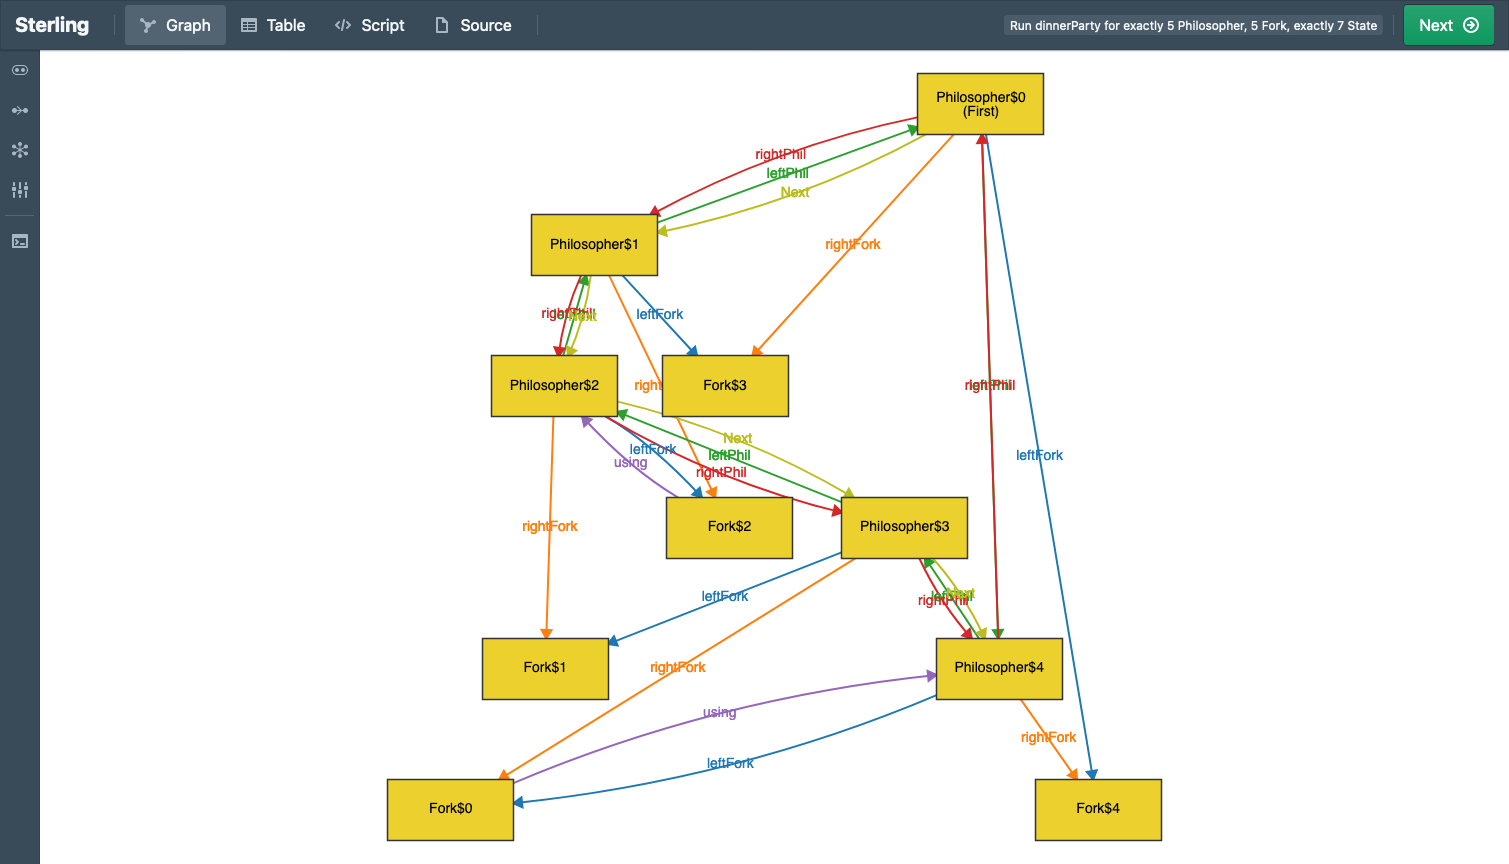
Just to whet your appetite, here is an example of what a default Sterling output looks like (Alloy’s visualizer would produce something similar, with fewer distinct colors, making it arguably even harder to see):
Here’s what custom visualization shows:
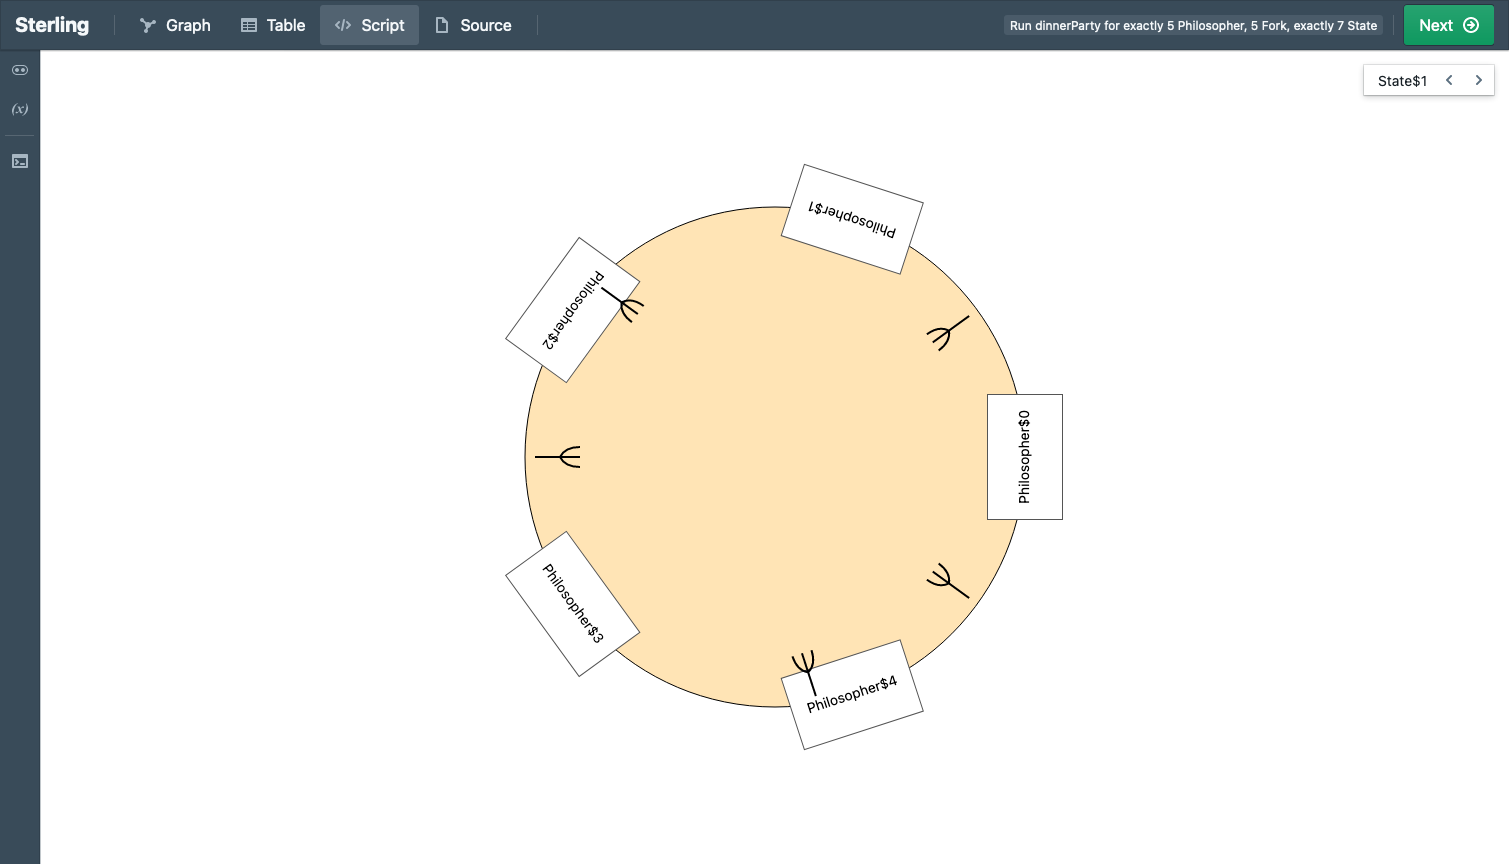
See the difference?
For more details, see the paper. And please try out Forge!
Acknowledgements
We are grateful for support from the U.S. National Science Foundation (award #2208731).