The Brown PLT Blog

Articles by tag: Spatial
Lightweight Diagramming for Lightweight Formal Methods
Diagramming Program Values by Spatial Refinement
Tags: Diagram, Programming Languages, Spatial, Tools, Visualization
Posted on 22 May 2026.Compilers can vectorize loops you never wrote. IDEs can finish functions before you do. Agents can refactor your codebase from a sentence. And yet, when you want to inspect the value your program just produced, you still use the REPL as if nothing has changed in fifty years: type an expression, get text back, squint. Here is Python showing you a binary decision diagram:
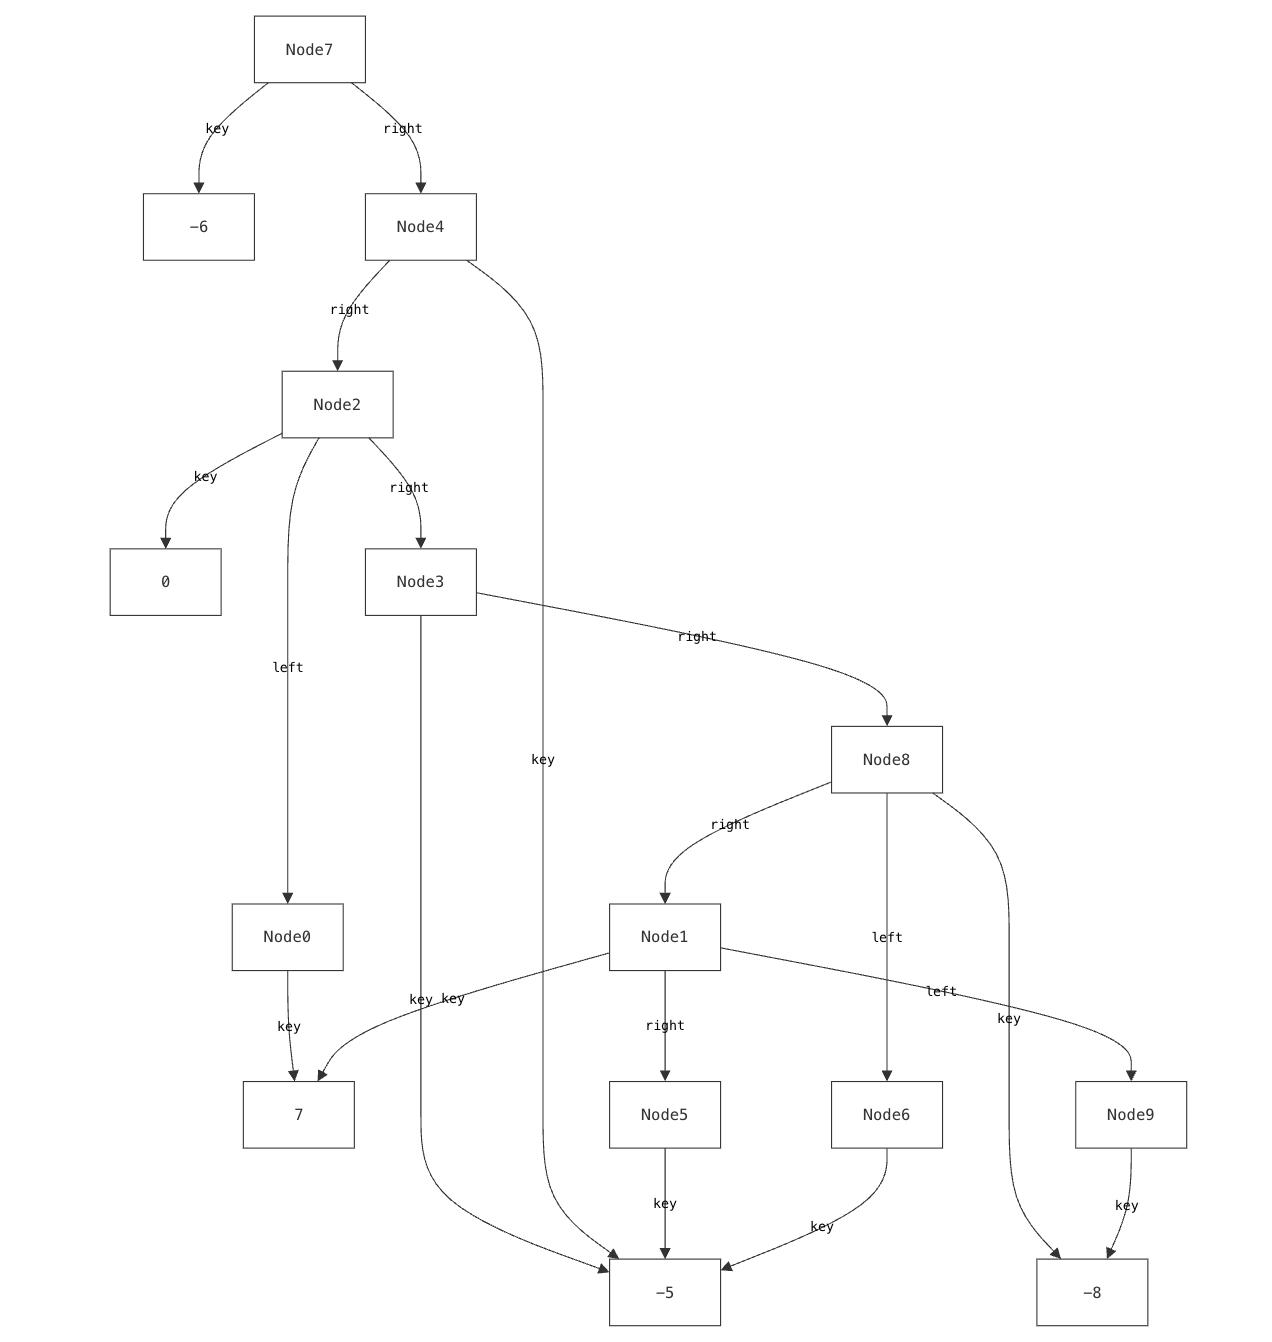
Node(15, 'x1', Node(14, 'x2', Node(8, 'x3', TRUE, FALSE), Node(4, 'x3', FALSE, TRUE)), Node(3, 'x2', FALSE, TRUE))
That is, technically, the value you wanted to inspect. The way it is shown is also not super useful. Anyone who has ever debugged a BDD knows the move that comes next: you reach for paper and pen and draw the thing, because we reason about these data structures spatially. (They are called binary decision diagrams, after all.)
What you want to see (and what you might draw by hand) is something like this:
The same Python value, shown diagrammatically. Spatial conventions are enforced in real time.
This diagram is useful because it embodies the spatial conventions we use when talking about BDDs: top-down variable layers, nodes grouped by variable, visually distinct high and low edges, and shared terminals. These conventions are how the data structure becomes readable. Try dragging the nodes around. You can move things, but you cannot break the rules: the BDD’s spatial conventions are preserved throughout.
So why not generate diagrams like this whenever we need them? Because the usual way is to write drawing code. Before the picture can tell you anything, you have to choose marks, compute positions, handle updates, and own a pile of rendering details. A tiny amount of that captures the BDD conventions that matter; most of it is scaffolding.
Here’s the thing: the language already gives us enough structure to draw a faithful diagram of the instance. To show you a value at the REPL, the runtime has to use mechanisms like introspection, printing, or serialization: ways of walking records, atoms, fields, and references. Turn records and atoms into nodes, fields and references into edges, and you get a diagram that preserves the value’s structure without asking the programmer to write drawing code. It may not be pretty, but it is faithful to the underlying value. The remaining diagramming work, then, is just of refinement. To abuse a line attributed to Michelangelo: David was already in the marble; the BDD was already in the value graph.
Spytial is a language built for this kind of diagramming of program values. It starts with the faithful value graph, then lets rules add the constraints that matter: same-variable nodes align, children sit below parents, high and low edges differ, implementation details disappear. Each rule makes the picture more like the diagram you wanted. Because the rules describe relationships rather than drawing steps, you are writing a specification, not a rendering pipeline.
The example below shows that process in stages: starting from the raw value structure, each stage adds more of the BDD convention until the diagram becomes recognizable.
Hide implementation noise
@attribute(field="nid")
@hideAtom(selector="NoneType + int")Align nodes that test the same variable
@align(selector="{x, y : Node | (x != y) and (x.v) = (y.v)}", direction="horizontal")Order layers top-to-bottom along the edges
@orientation(selector="{x, y : Node | x->y in (lo + hi)}", directions=["below"])Group nodes that share a variable
@group(selector="{vr : str, y : Node | @:(vr) = @:(y.v)}", name="nodes")
@hideAtom(selector="str")Apply visual conventions
@atomColor(selector="{x: Node | @num:(x.nid) = 0}", value='red')
@atomColor(selector="{x: Node | @num:(x.nid) = 1}", value='blue')
@atomColor(selector="{x: Node | (@num:(x.nid) > 1)}", value='black')
@edgeColor(field="hi", value='green')
@edgeColor(field="lo", value='orange')
@orientation(selector="{x, y : Node | x->y in lo and (@num:(y.nid) > 1)}", directions=["left"])
@orientation(selector="{x, y : Node | x->y in hi and (@num:(y.nid) > 1)}", directions=["right"])More precisely, a Spytial program denotes a set of acceptable 2D layouts, and each rule narrows that set by selecting the atoms and edges it constrains. A selector such as {x, y : Node | (x != y) and (x.v) = (y.v)} matches every pair of distinct nodes that test the same variable — on any BDD, not just this one. Because selectors describe structural patterns rather than rendering steps, rules are declarative and order-independent. There is no if, no callback, no rendering pipeline to maintain. You are writing a specification, not coding a visualizer.
By making spatial description a programming-languages problem, Spytial can do more than draw pictures. When rules conflict, the diagnostic can itself be spatial: Spytial isolates a minimal conflicting subset of constraints, relaxes it to produce a counterfactual diagram, and ties the offending elements back to the rules that caused the inconsistency. And because a specification describes a space of acceptable pictures rather than a single one, the same specifications can also run backward, enabling value construction through the diagram.
Spytial is designed to work across programming paradigms. We have integrated it with Python, Rust, and Pyret, and we would love to see it in your favorite language too.
To see what that looks like in practice, explore our language integrations.
You can also see Spytial at work in a collection of data-structure visualizations drawn from the classic algorithms textbook Introduction to Algorithms by Cormen, Leiserson, Rivest, and Stein: spytial-clrs.netlify.app.
To learn more, read our PLDI 2026 paper.
Spytial is related to our Cope and Drag system for formal-methods visualization. Read the related blog post here.
Lightweight Diagramming for Lightweight Formal Methods
Tags: Diagram, Formal Methods, Spatial, Tools, Verification, Visualization
Posted on 09 June 2025.We now also have Spytial, a newer version of this idea for diagramming program values.
Formal methods tools like Alloy and Forge help users define, explore, verify, and diagnose specifications for complex systems incrementally. A crucial feature of these tools is their visualizer, which lets users explore generated models through graphical representations.
In some cases, they suffer from familiar usability issues—such as overlapping lines, unclear labels, or cluttered layouts—that make it hard to understand what the model represents. But even when the diagrams are clean and well-organized, they can still be confusing if the layout doesn’t reflect the structure that users expect.
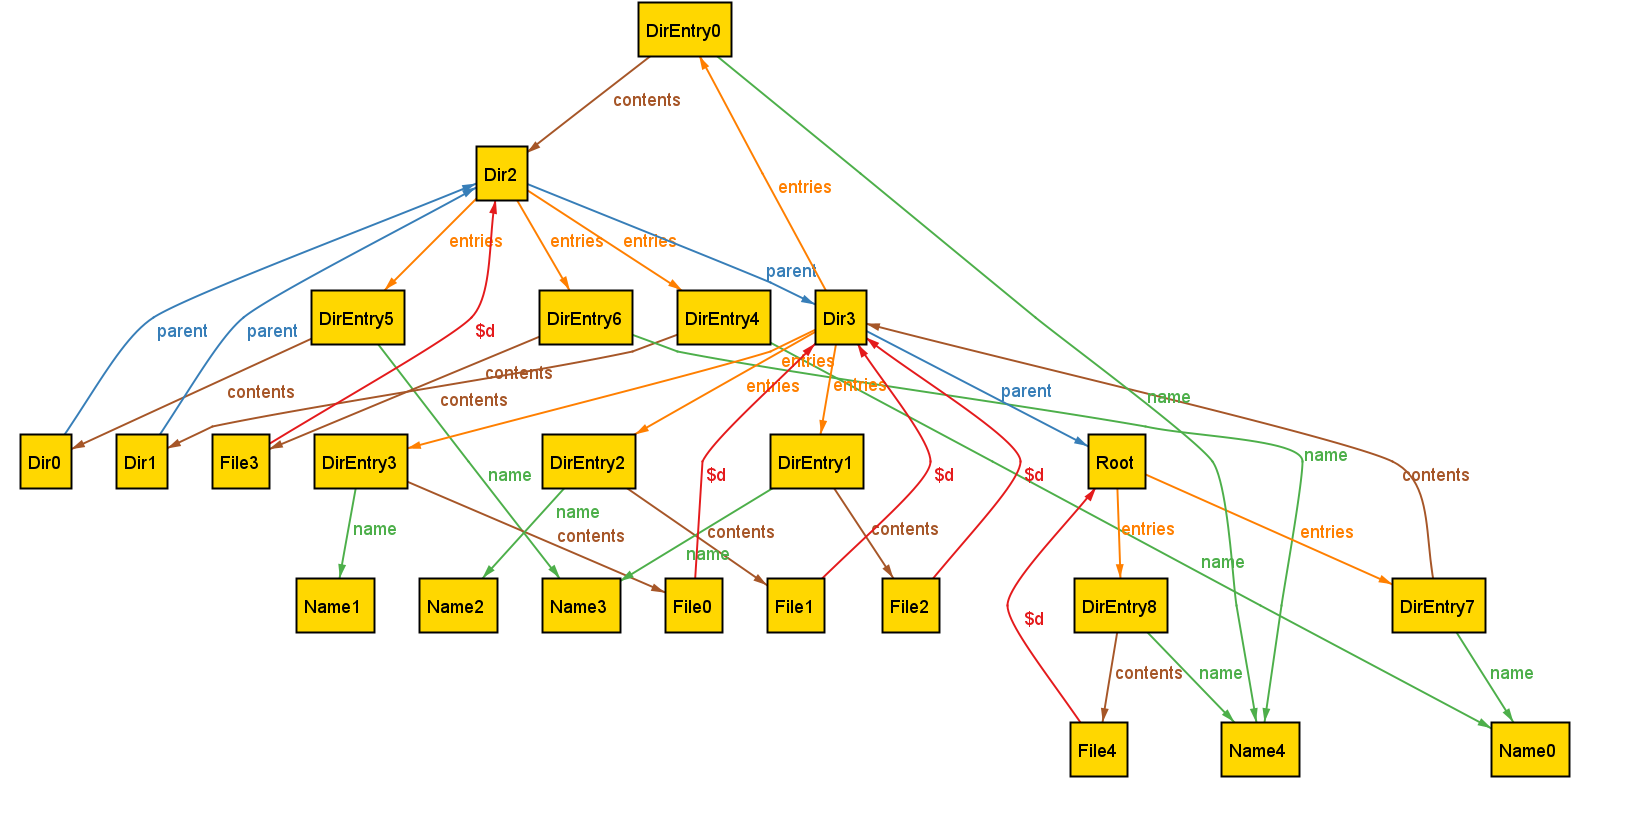
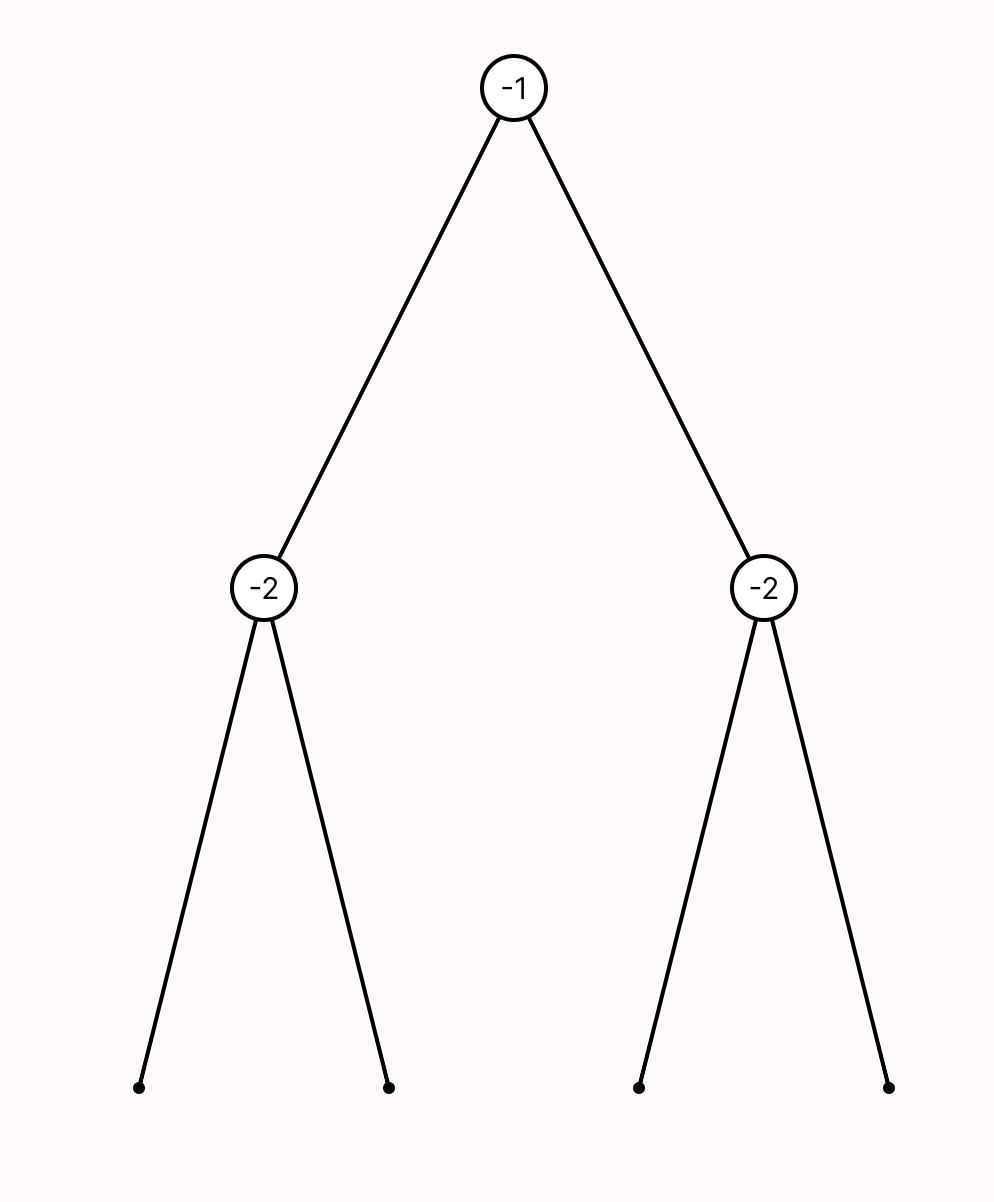
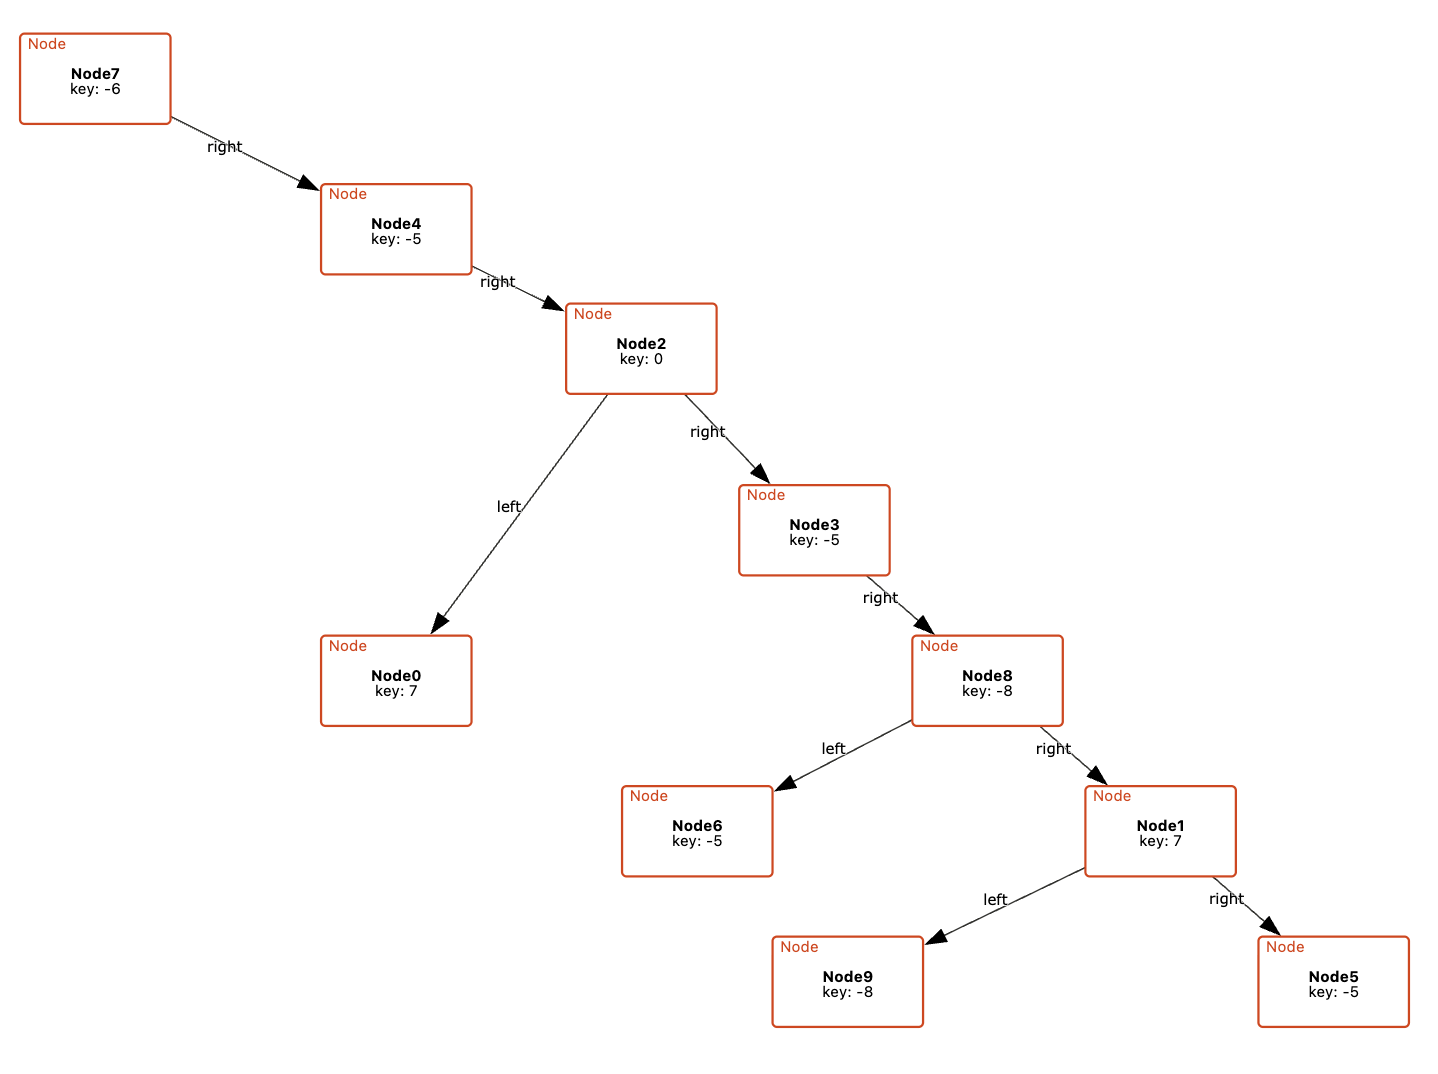
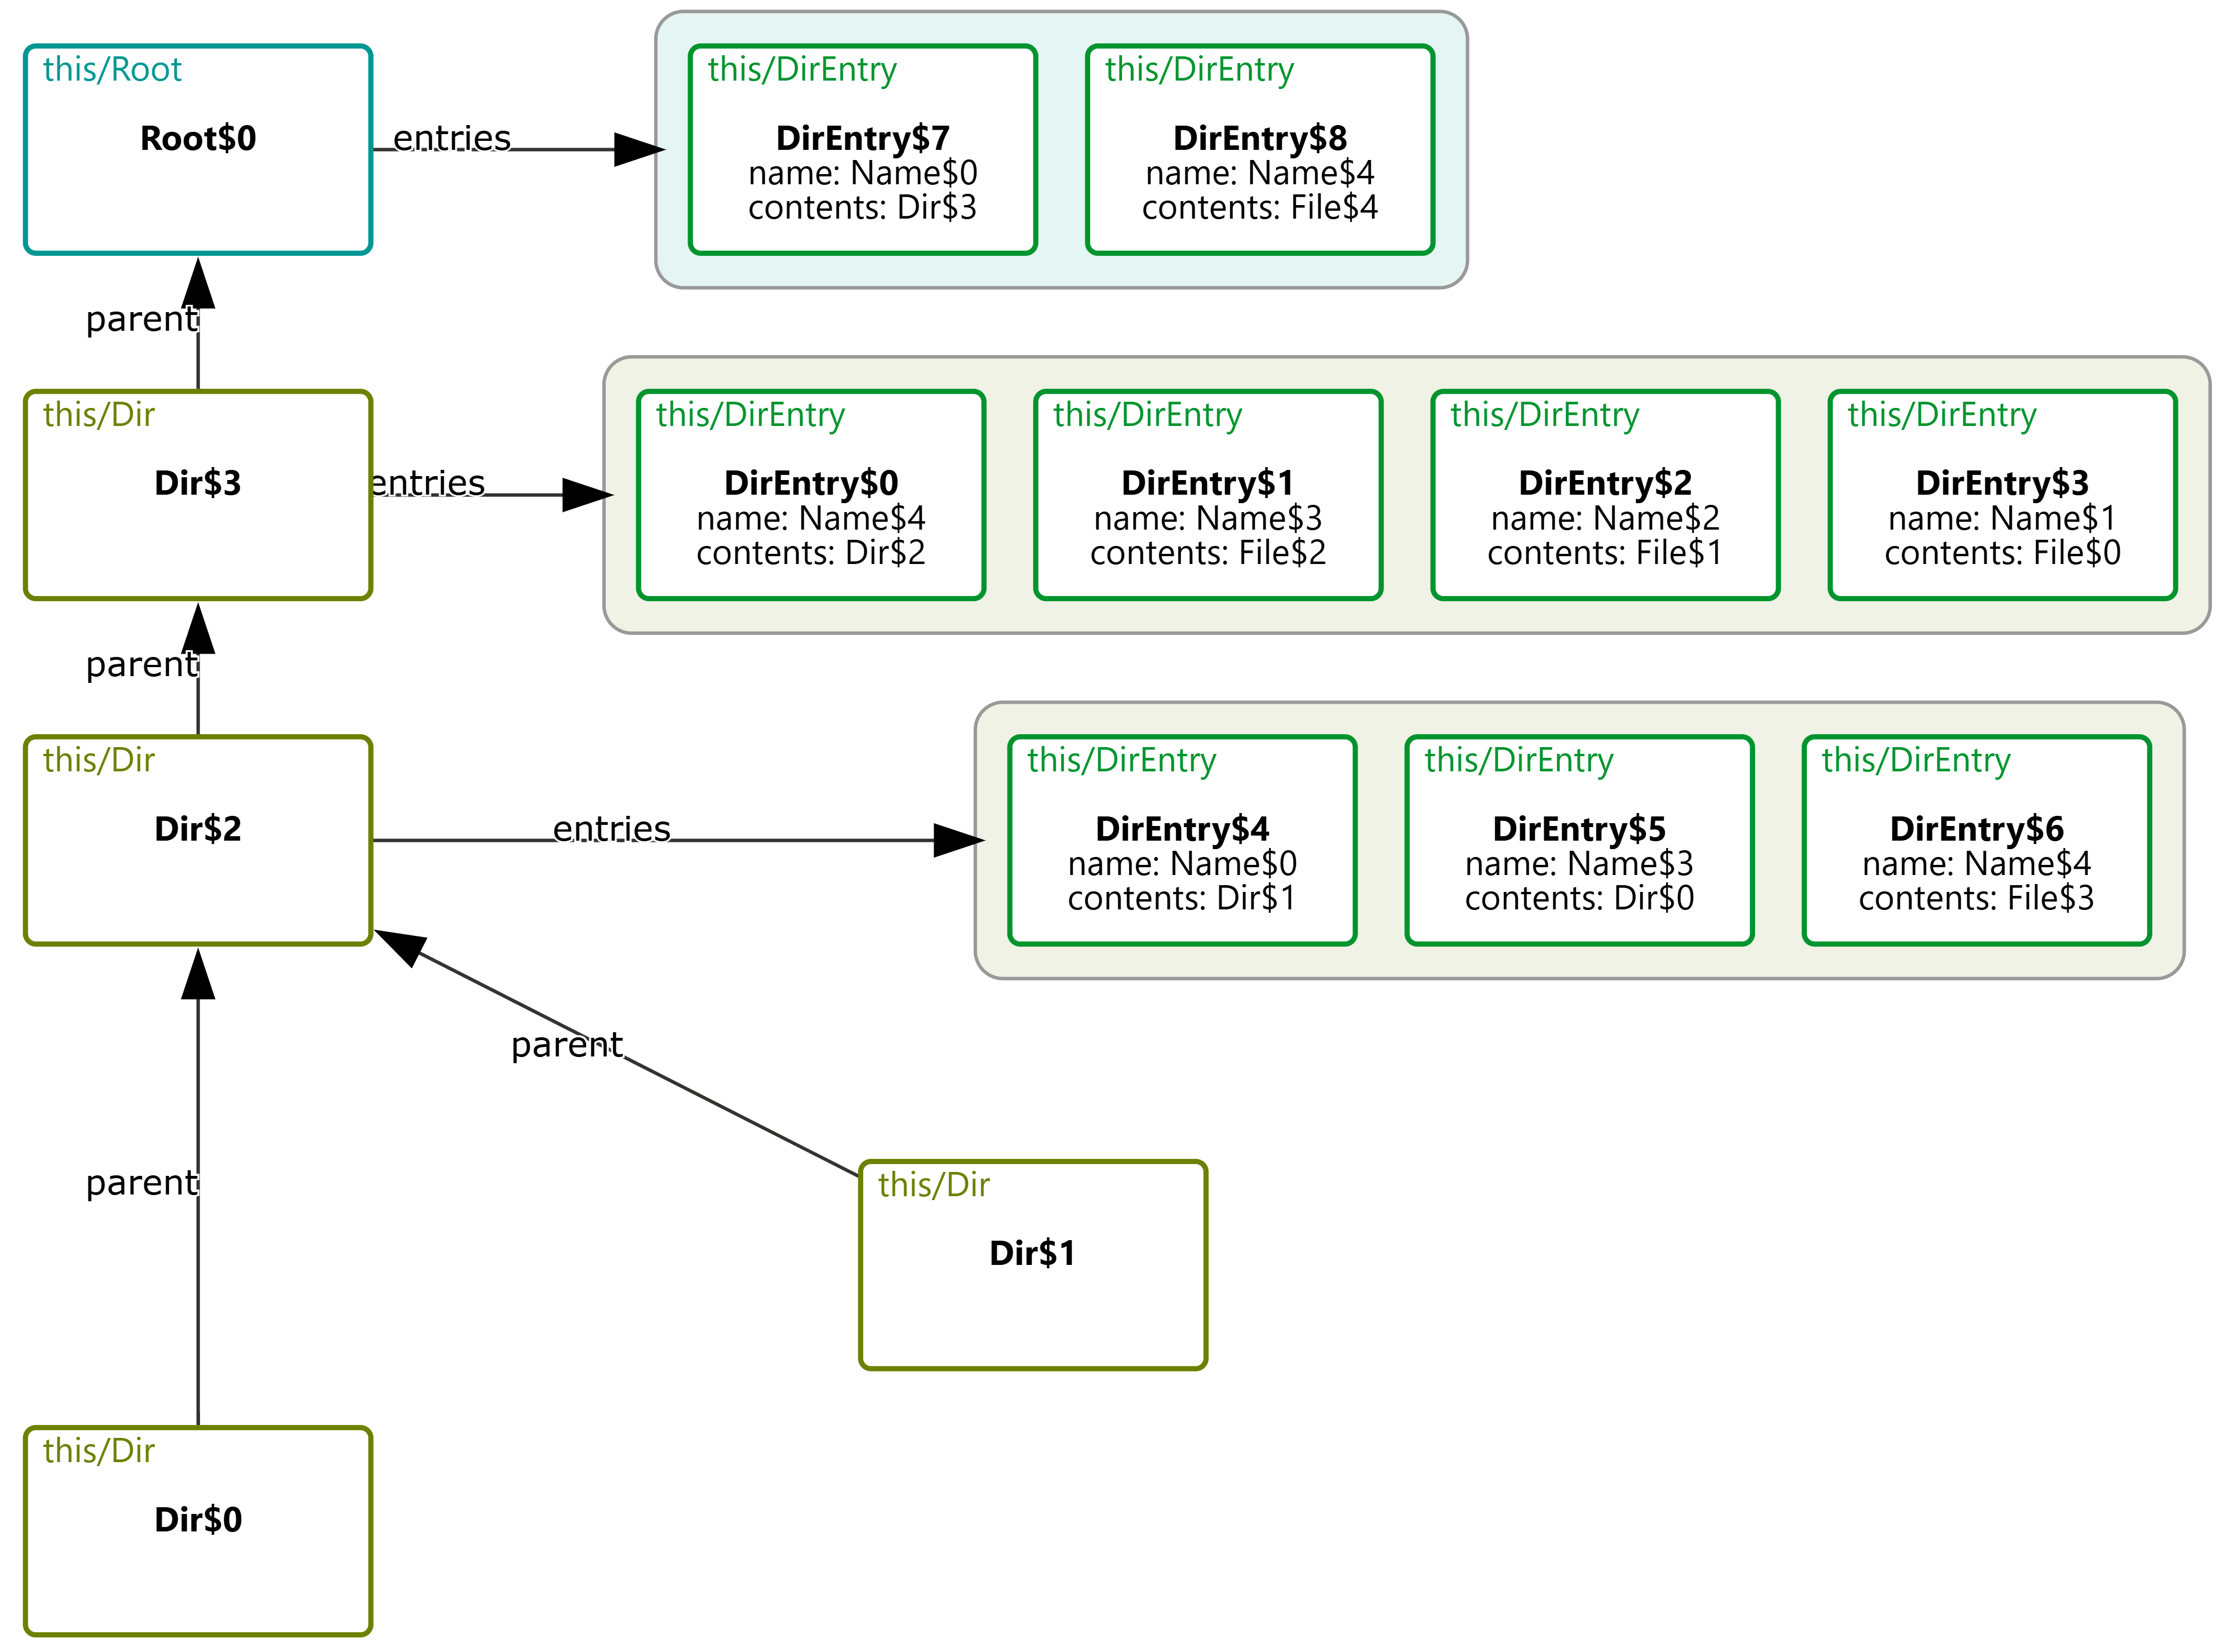
For example, a visualization of a binary tree might place left and right children arbitrarily, rather than arranging them to the left and right of their parent node. This breaks with common conventions and can make it harder for users to quickly recognize familiar structures. Similarly, if a model is meant to convey a specific organization (e.g., the grouping of files in a directory) but the visualization fails to reflect this, it becomes difficult to discern the intended relationships, making the model harder to interpret and reason about.
Our previous research has explored using custom, domain-specific visualizations to address this challenge. Yet existing tools for custom visualization come with several significant drawbacks:
- Users must learn and use entirely different languages to create custom visualizations, learning skills (like CSS) that have nothing to do with formal modeling.
- The level of detail required by these languages (such as controlling how elements are rendered) often makes the visualizer code larger and more complex than the models themselves.
- Most critically, these visualizations can be brittle. While careful visualization design can handle certain edge cases, they are inherently limited by their authors’ assumptions about potential issues. The very “unknown unknowns” that lightweight formal methods exist to help surface are often masked by visualizers.
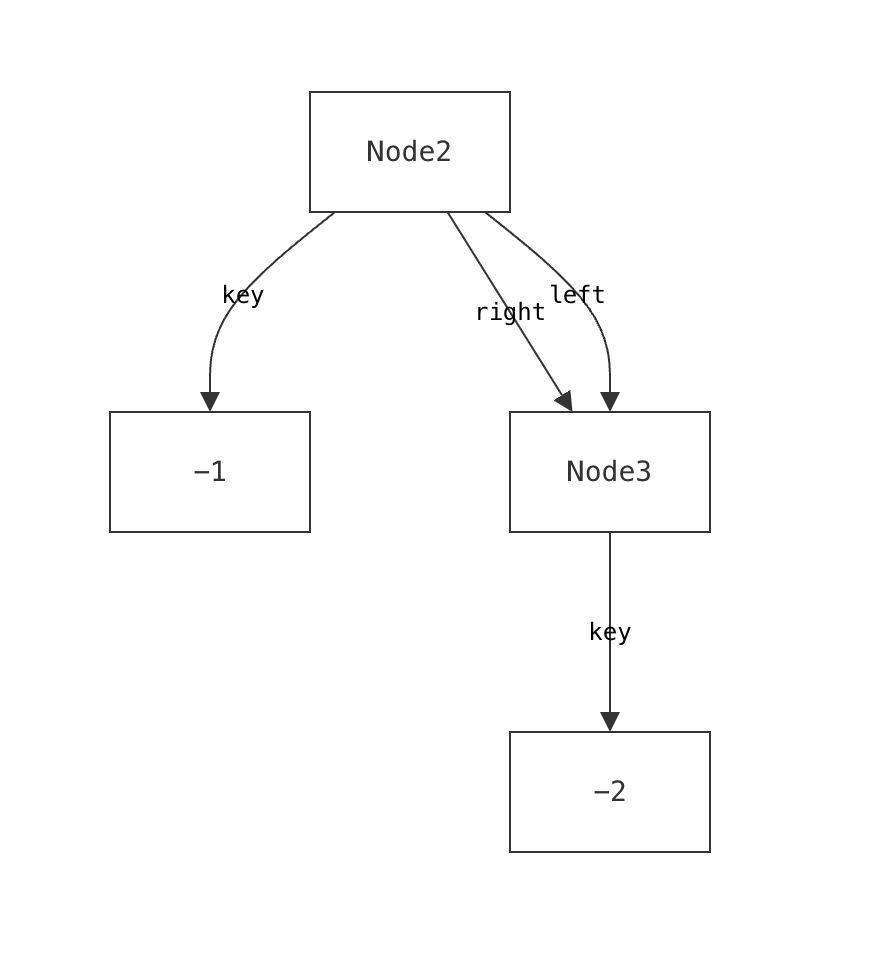
We encountered this issue even when building visualizations for relatively simple data structures that we understand well. It is well-documented that experts suffer from blind spots about what mistakes students might make. When faced with such a modeling mistake, failing to specify that a node’s left and right children must be distinct, our custom visualizer failed silently.
Such failures aren’t merely aesthetic—they actively prevent users from discovering a specification error.
Cope and Drag (or CnD) is a novel lightweight diagramming language built to address these issues. CnD’s design was driven by two approaches:
- A top-down exploration of cognitive science principles that influence spatial reasoning, visualization, and diagramming.
- A bottom-up analysis that distills patterns from dozens of actual custom visualizations.
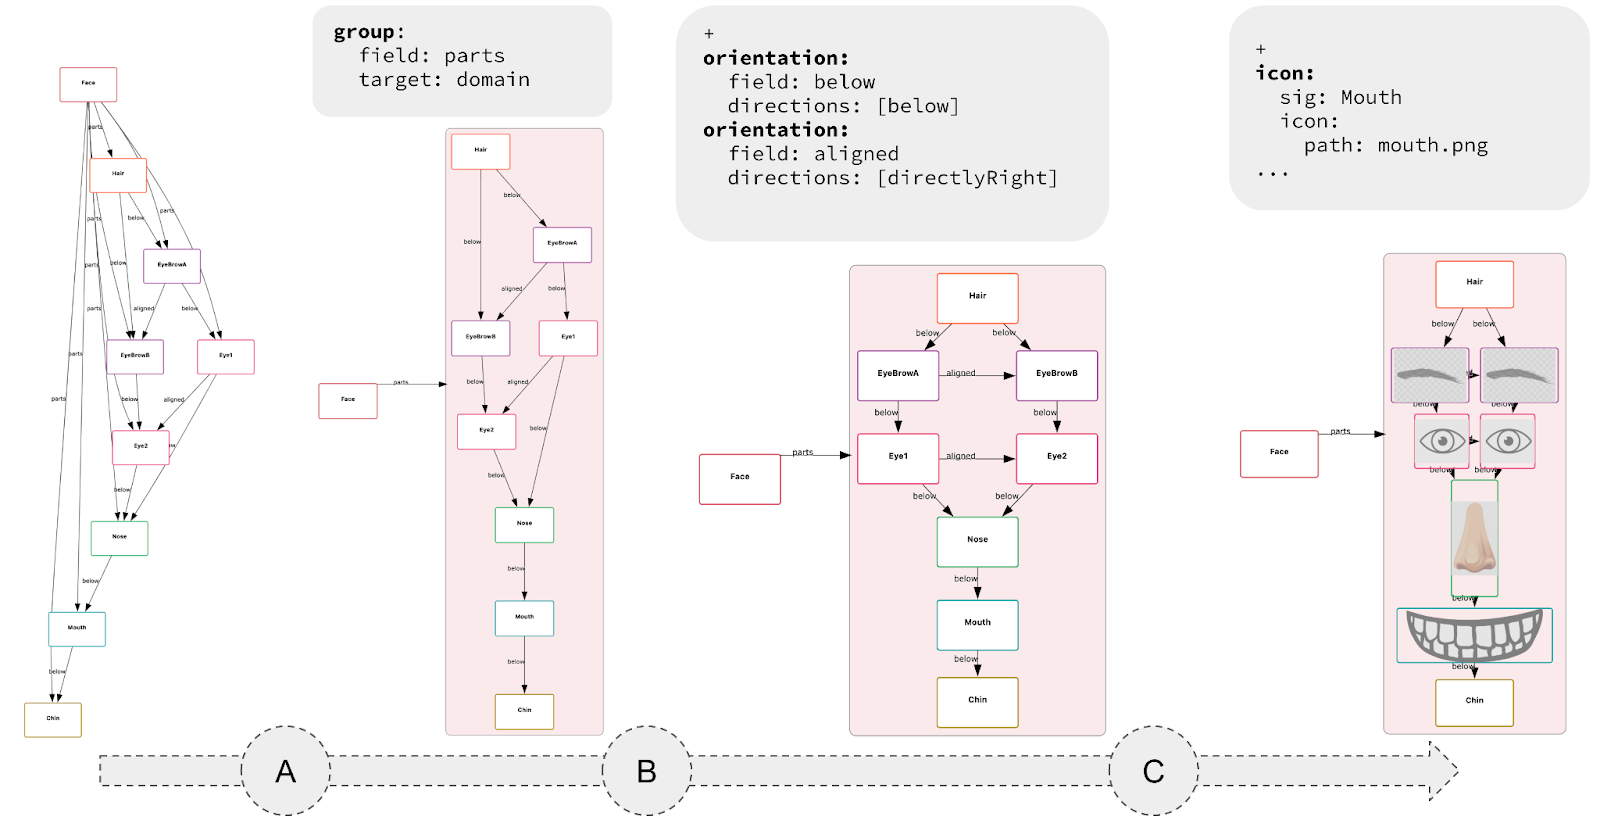
The resulting language is small, requires minimal annotation, and can be used incrementally. The key idea is that each CnD operation meaningfully refines the default visualization. These operations include constraining spatial layout (such as positioning child nodes below their parents in a binary tree), grouping elements (like clustering related components in a software architecture), and directing drawing style (for instance, coloring nodes in a red-black tree based on their color).
Rather than prioritizing aesthetics, CnD focuses on encoding the spatial intuitions implicit in communicating the model. Its lightweight, declarative structure captures these relationships directly.
-
Lightweight Specs, Not Programs: Diagramming with CnD resembles writing a spec, not coding a full program. An empty spec yields a default diagram; each constraint refines it. Unlike traditional viz tools like D3 (where you don’t get a visualization until you’ve written a full program) CnD supports incremental visualization, making it easy to start and evolve alongside your model.
- Useful, not pretty: Generated diagrams may lack the visual polish of more sophisticated tools, but they prioritize structural clarity and correctness over style.The trade-off is a lower ceiling: user’s have less fine-grained control over how diagram elements are rendered (e.g., spacing, fonts, shapes).
-
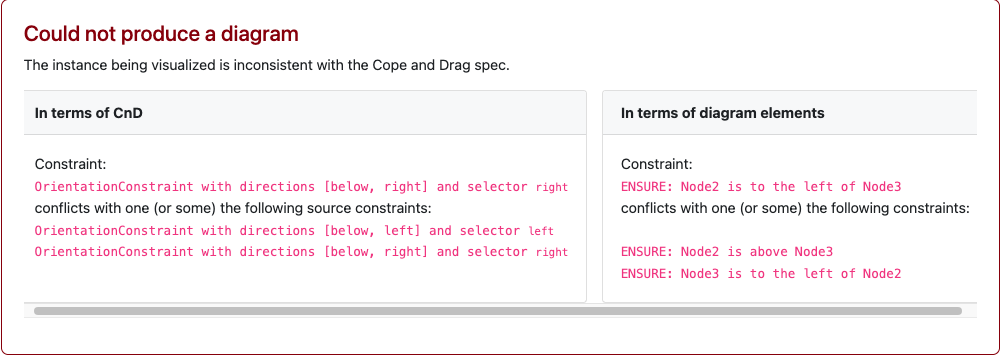
Fail Loudly: CnD constraints are hard constraints. When a diagram fails to match the model, the system prevents visualization and produces a solver-generated error.
For instance, a CnD specification for a binary tree might encode tree layouts as two constraints (lay the left child below and to the left of its parent, and the right child below and to the right of the parent). When faced with the DAG described earlier, CnD identifies that these visualization constraints are unsatisfiable, and produces an error message instead of a misleading diagram.
CnD isn’t the final word on diagramming. It’s one design point in a larger landscape, trading visual polish for ease of use, structural clarity, and exploration of model-diagram mismatches. Other tools will (and should) explore different trade-offs.
CnD is embedded in an open-source visualizer for Forge. We encourage you to try it as part of your existing Forge workflows. To learn more about CnD, please read our paper!